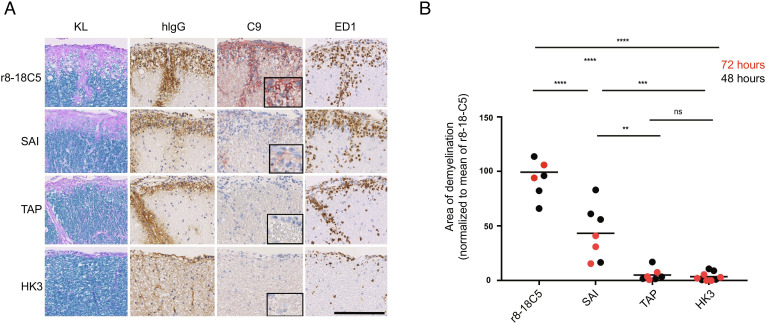
Fig. 3.
Histopathology of the EAE induced by MBP-specific T cells and mutated MOG antibodies. Spinal cord sections of Lewis rats, which developed EAE subsequent to transfer of T cells specific for MBP (A and B). Animals were intraperitoneally injected 72 h prior to the analysis (day 5) with the MOG-specific antibodies r8-18C5 (positive control), SAI (abolished C1q binding with intact FcγR binding), or TAP (abolished binding to C1q and to FcγRI and FcγRIV). The antibody HK3 was used as negative control. For each experimental animal, consecutive spinal cord sections were subjected to Kluver–Barrera (KL) staining to show the presence (turquoise) or absence (light blue/pink) of myelin, or to stainings with antibodies specific for human immunoglobulin G (hIgG, brown) to reveal the presence of the antibodies in the tissue, for complement C9neo (C9neo, red) to reveal the terminal membrane attack complex as indicator for complement-dependent (cellular) cytotoxicity, and with the antibody ED1 (brown) specific for macrophages/activated microglia needed for antibody-dependent cellular cytotoxicity. Counterstaining was done with hematoxylin to reveal nuclei (blue). Bar = 100 µm. (B) The spinal cords were used for the quantification of demyelination of animals after 48 h of antibody injection (black dots) or 72 h (red dots) of injection. We normalized the 48-h animals (TAP, SAI, and HK3) to the mean value of demyelination (mm2) of all rats for r8-18C5 and expressed it as percentage. In the same figure, we also merged the 72-h animals which we label in red (normalized to the r8-18C5 after 72 h). One-way ANOVA with Tukey’s test (four groups) was performed for comparison between groups. P < 0.05 was considered significant.

