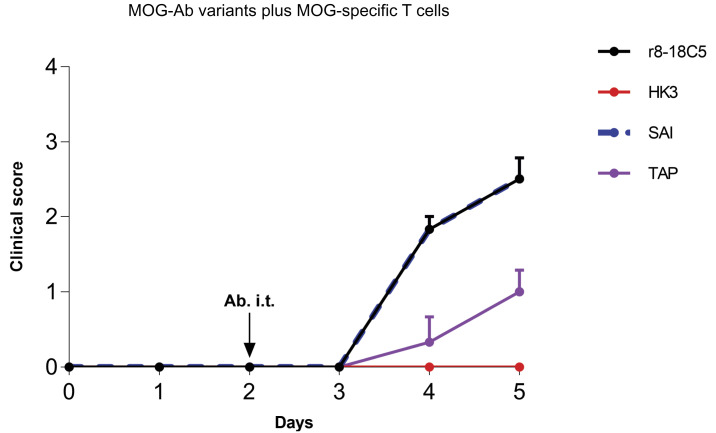
Fig. 4.
Clinical EAE in the model with cognate MOG-specific T cells and mutated MOG-Abs. Lewis rats were injected with MOG-specific T cells that do not induce clinical disease on their own. At day 2, the indicated nonmutated MOG-Abs, the mutated MOG-Abs, and the control Ab HK3 were injected intraperitoneally. Histology and FACS analysis of the infiltrates were performed at day 5. Development of the clinical disease over time. The clinical score displayed represents the mean + SEM of the following number of animals. r8-18C5 (n = 3), SAI (n = 3), TAP (n = 3), HK3 (n = 3). One-way ANOVA with Tukey’s test (four groups) was performed for comparison between groups. P < 0.05 was considered significant. Day 4: r8-18C5 vs. SAI = ns; r8-18C5 vs. TAP P ≤ 0.01; r8-18C5 vs. HK3 P ≤ 0.001; SAI vs. TAP P ≤ 0.01; SAI vs. HK3 P ≤ 0.001; TAP vs. HK3 = ns. Day 5: r18C5 vs. SAI =ns; 8-18C5 vs. TAP P ≤ 0.05; r8-18C5 vs. HK3 ≤ 0.001(***), SAI 5 vs. TAP P ≤ 0.05; SAI vs. HK3 P ≤ 0.001; TAP vs. HK3 = ns.

