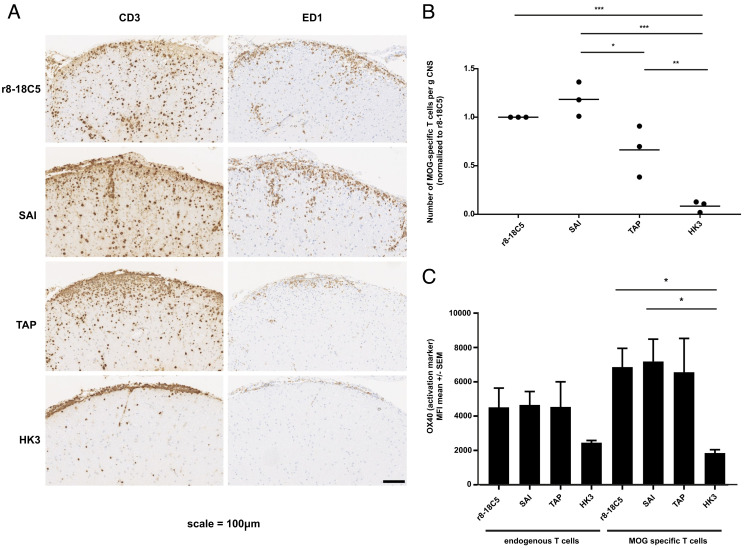
Fig. 5.
Pathology of the EAE induced by MOG-specific T cells and mutated MOG antibodies. Lewis rats received MOG-specific T cells 2 d before the MOG-specific antibodies r8-18-C5 (positive control), SAI (abolished C1q binding and intact FcγR binding), TAP (abolished C1q binding and abolished binding to FcγRI and FcγRIV), or the control Ab HK3 were injected. After 72 h, about half of the spinal cords were fixed with PFA, embedded, and analyzed for histopathology (A and B), while the other half of the spinal cords were processed for FACS analysis (C). (A and B) For each experimental animal, consecutive spinal cord sections were stained with anti-CD3 antibodies to visualize T cells (brown) and the ED1 antibody to show macrophages/activated microglia (brown). Counterstaining was done with hematoxylin to reveal nuclei (blue). Bar = 100 µm. (C) The same spinal cords were used for the quantification of T cells via flow cytometry and their activation status reflected by OX40 expression was determined. MOG-specific T cells were separated from endogenous bystander T cells by their fluorescence properties. The number of MOG-specific T cells is displayed in relation to the amount observed after injection of the r8-18C5 (set as 1). (C) The activation status of endogenous bystander T cells and injected MOG-specific T cells in the CNS inflammatory lesions was determined by staining for the activation marker OX40. One-way ANOVA with Tukey’s test (four groups) was performed for comparison between groups. P < 0.05 was considered significant.

