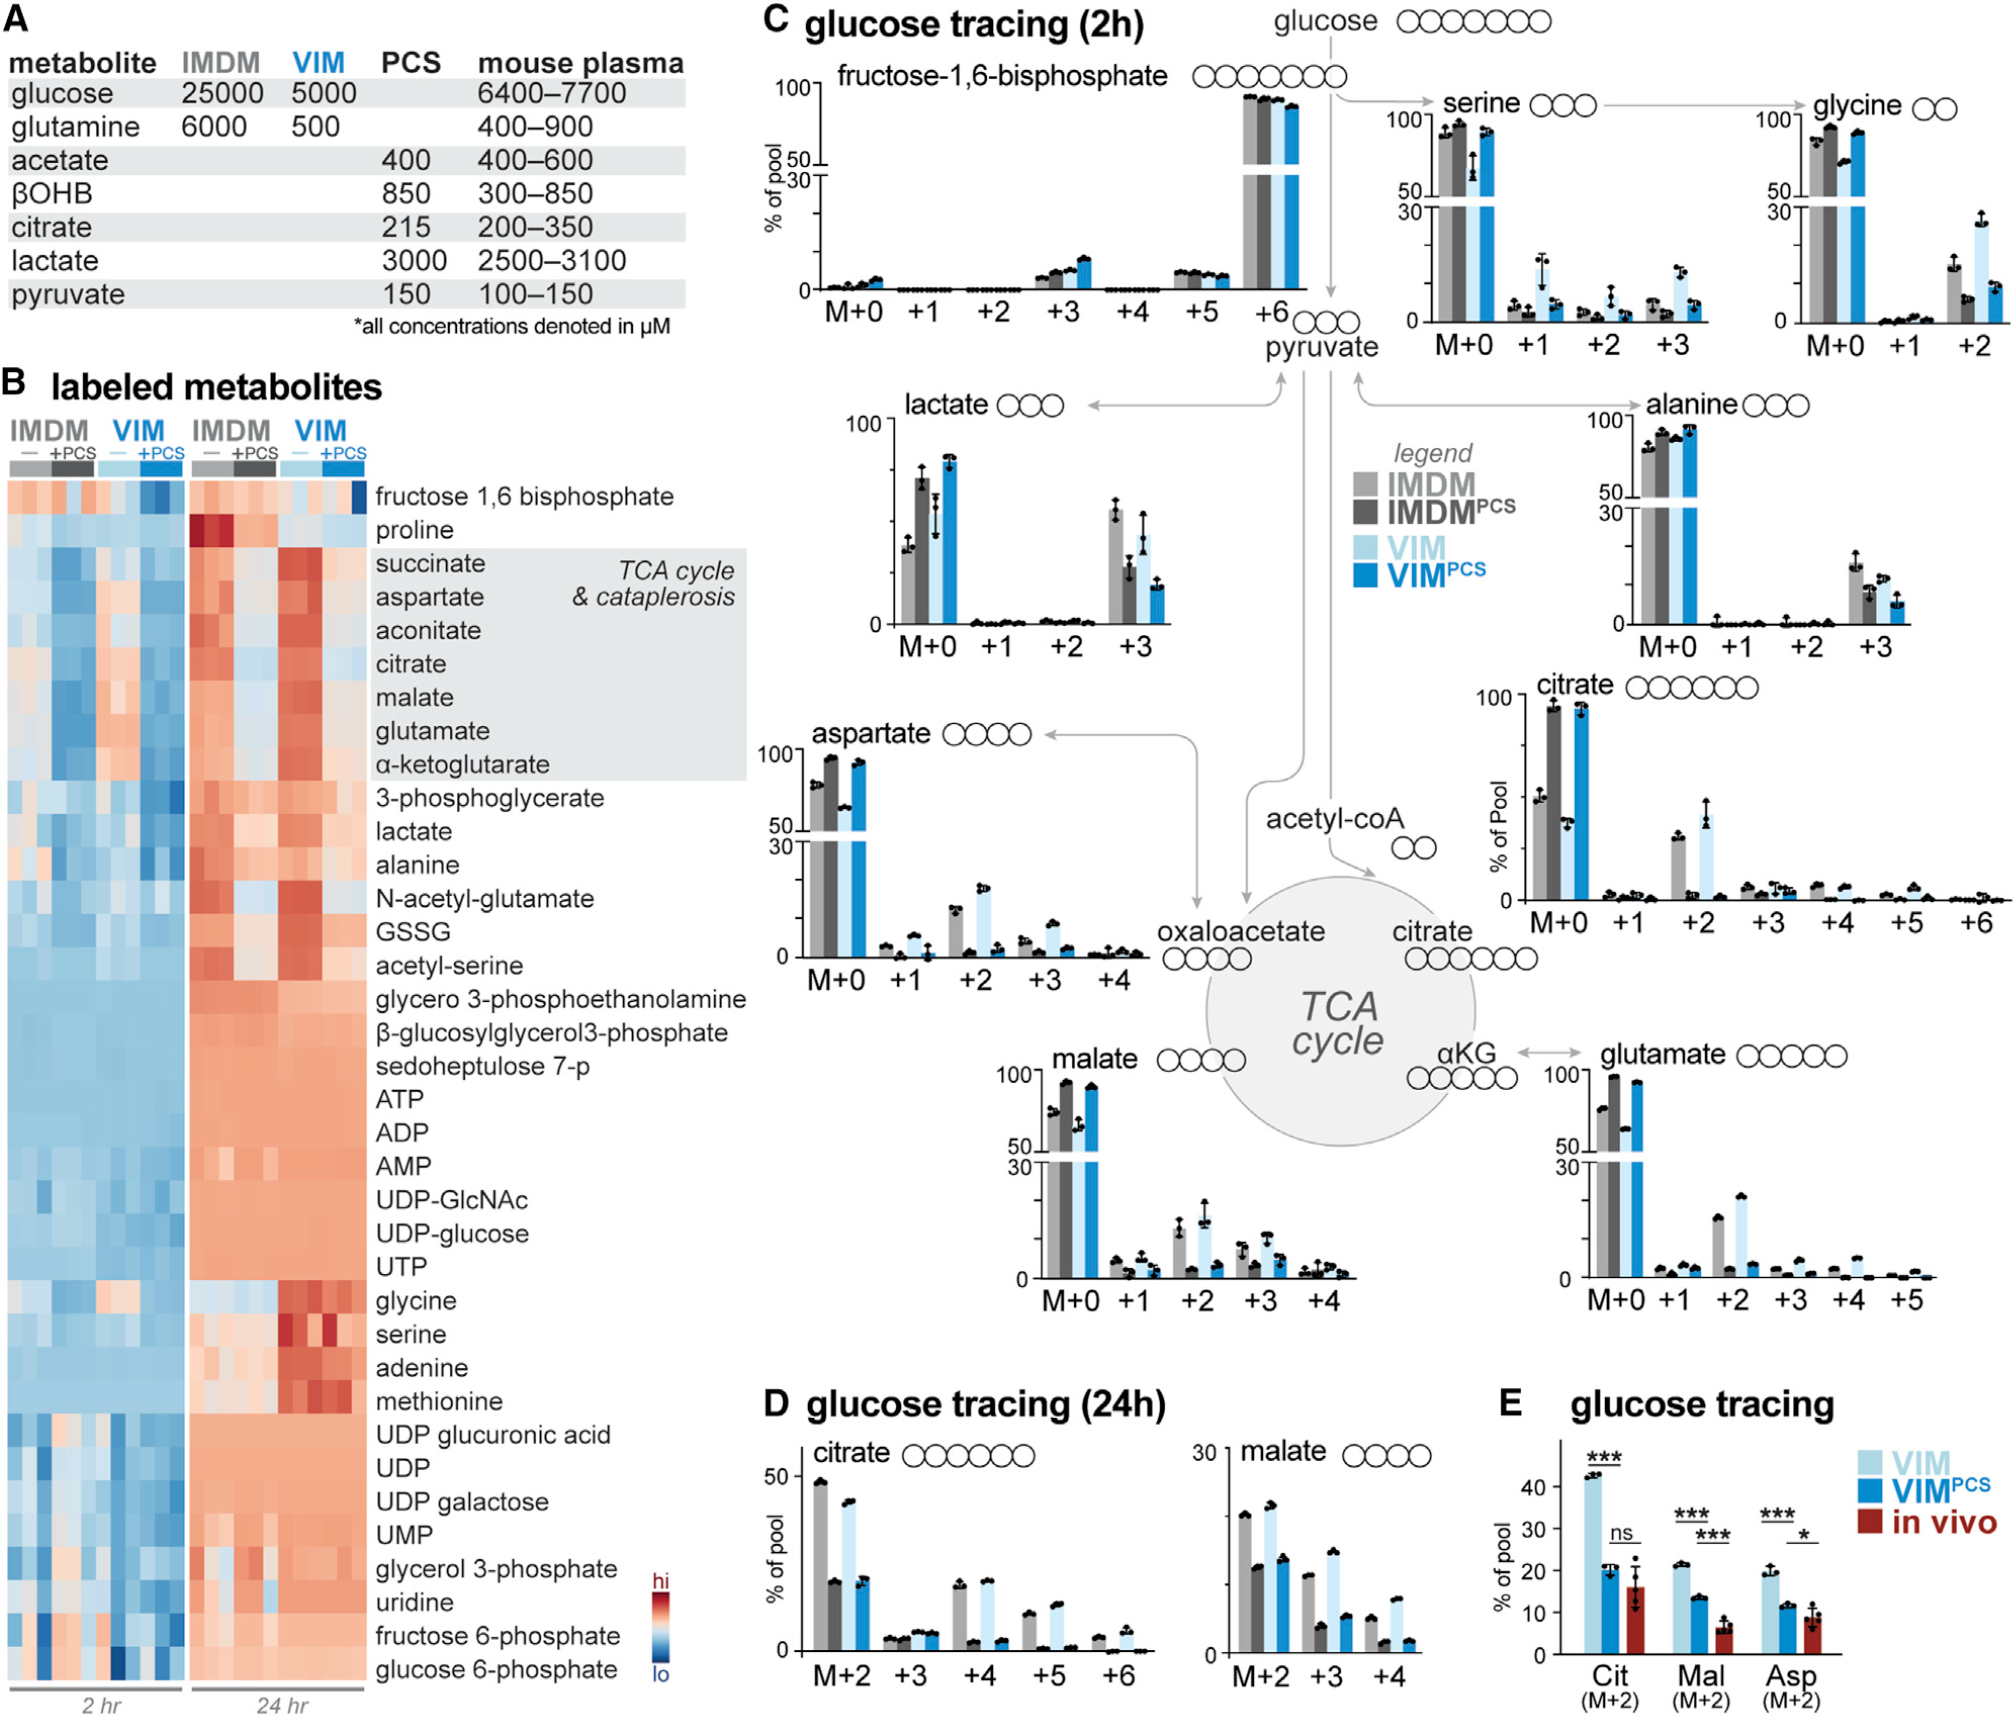
Figure 1. Physiologic carbon sources influence glucose utilization by T cells.

(A) Table highlighting major medium components of IMDM and VIM and physiologic carbon sources (PCSs) used in this study. Concentration ranges for metabolites in mouse serum are provided for comparison (Table S1).
(B) Heatmap depicting relative incorporation of 13C from [U-13C]-glucose into the indicated intracellular metabolites from activated CD8+ T cells cultured in IMDM or VIM with (+) or without (−) PCSs. Activated (CD44+) T cells were cultured in the indicated medium containing [U-13C]-glucose for 2 or 24 h (n = 3/group).
(C) Mass isotopologue distribution (MID) for [U-13C]-glucose-derived metabolites for activated CD8+ T cells cultured in IMDM (gray) or VIM (blue) with or without PCSs. Shown are MID labeling patterns for select metabolites after 2 h of culture as in (B) (mean ± SEM, n = 3/group).
(D) MID labeling patterns for [U-13C]-glucose-derived citrate and malate for CD8+ T cells cultured in IMDM (gray) or VIM (blue) with or without PCSs for 24 h as in (B) (mean ± SEM, n = 3/group).
(E) Fractional enrichment of [U-13C]-glucose-derived carbon in TCA cycle intermediates in activated CD8+ T cells. T cells activated as in (B) were cultured with [U-13C]-glucose in VIM or VIM plus PCS (VIMPCS) for 24 h. For infusion samples (in vivo), fractional enrichment of [U-13C]-glucose into TCA cycle intermediates was determined relative to [U-13C]-glucose abundance in spleen (mean ± SEM, n = 3–6/sample) (data from Ma et al., 2019).
*p < 0.05, **p < 0.01, ***p < 0.001, ****p < 0.0001; ns, not significant.
