
Figure 3. Physiologic carbon sources contribute to TCA cycle metabolism and biosynthesis.
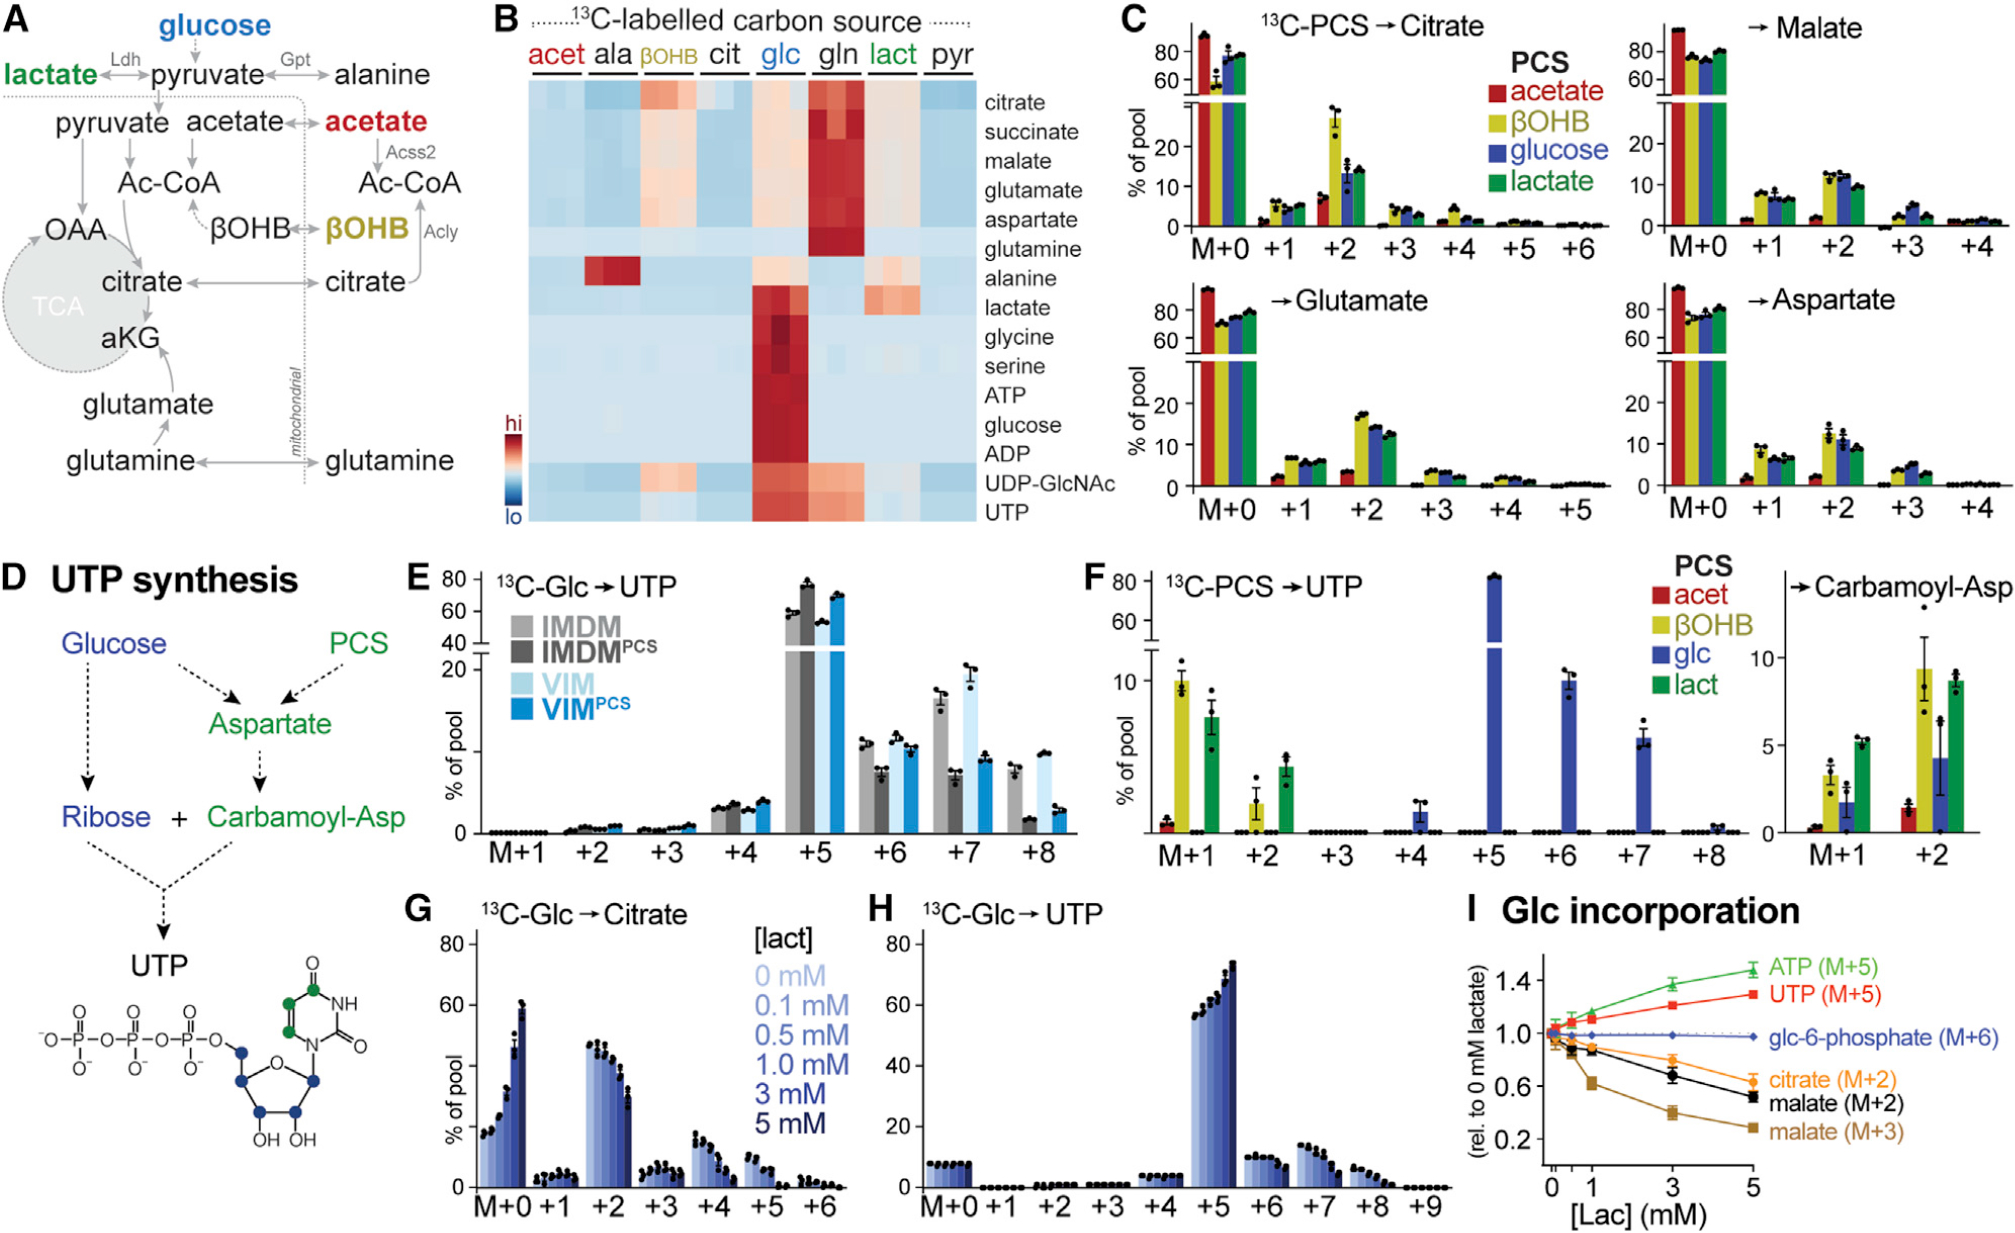
(A) Schematic depicting potential contribution of carbon sources to TCA cycle metabolism. Enzyme reactions localized to the cytosol and mitochondrion are indicated, with metabolic enzymes listed in gray.
(B) Heatmap depicting relative contribution of 13C from indicated [U-13C]-labeled substrates into metabolites of central carbon metabolism in activated CD8+ T cells after 24 h of culture (n = 3/group).
(C) MIDs for [U-13C]-PCS-derived carbon into citrate, malate, glutamate, and aspartate for CD8+ T cells cultured as in Figure 1B. Shown are individual isotopologues derived from acetate, βOHB, glucose, and lactate after 24 h of culture (mean ± SEM, n = 3/group).
(D) Schematic showing pathways for UTP synthesis from glucose and PCSs.
(E) MIDs for [U-13C]-glucose-derived UTP for activated CD8+ T cells cultured in IMDM or VIM with or without PCSs. Shown are MID labeling patterns from [U-13C]-glucose into UTP after 24 h of culture (mean ± SEM, n = 3/group).
(F) MID labeling pattens in UTP and carbamoyl-aspartate for in vitro-activated CD8+ T cells cultured in VIMPCS for 24 h. Shown are individual isotopologues derived from specific metabolites as in (C) (mean ± SEM, n = 3/group).
(G and H) MIDs for [U-13C]-glucose-derived citrate (G) and UTP (H) for activated CD8+ T cells cultured for 24 h in VIM supplemented with indicated concentrations of lactate (mean ± SEM, n = 3/group).
(I) Change in MID from [U-13C]-glucose into indicated metabolite isotopologues in activated CD8+ T cells cultured for 24 h in VIM containing increasing concentrations of lactate. Changes in MID were determined relative to cells cultured in VIM containing no lactate (mean ± SEM, n = 3/group).