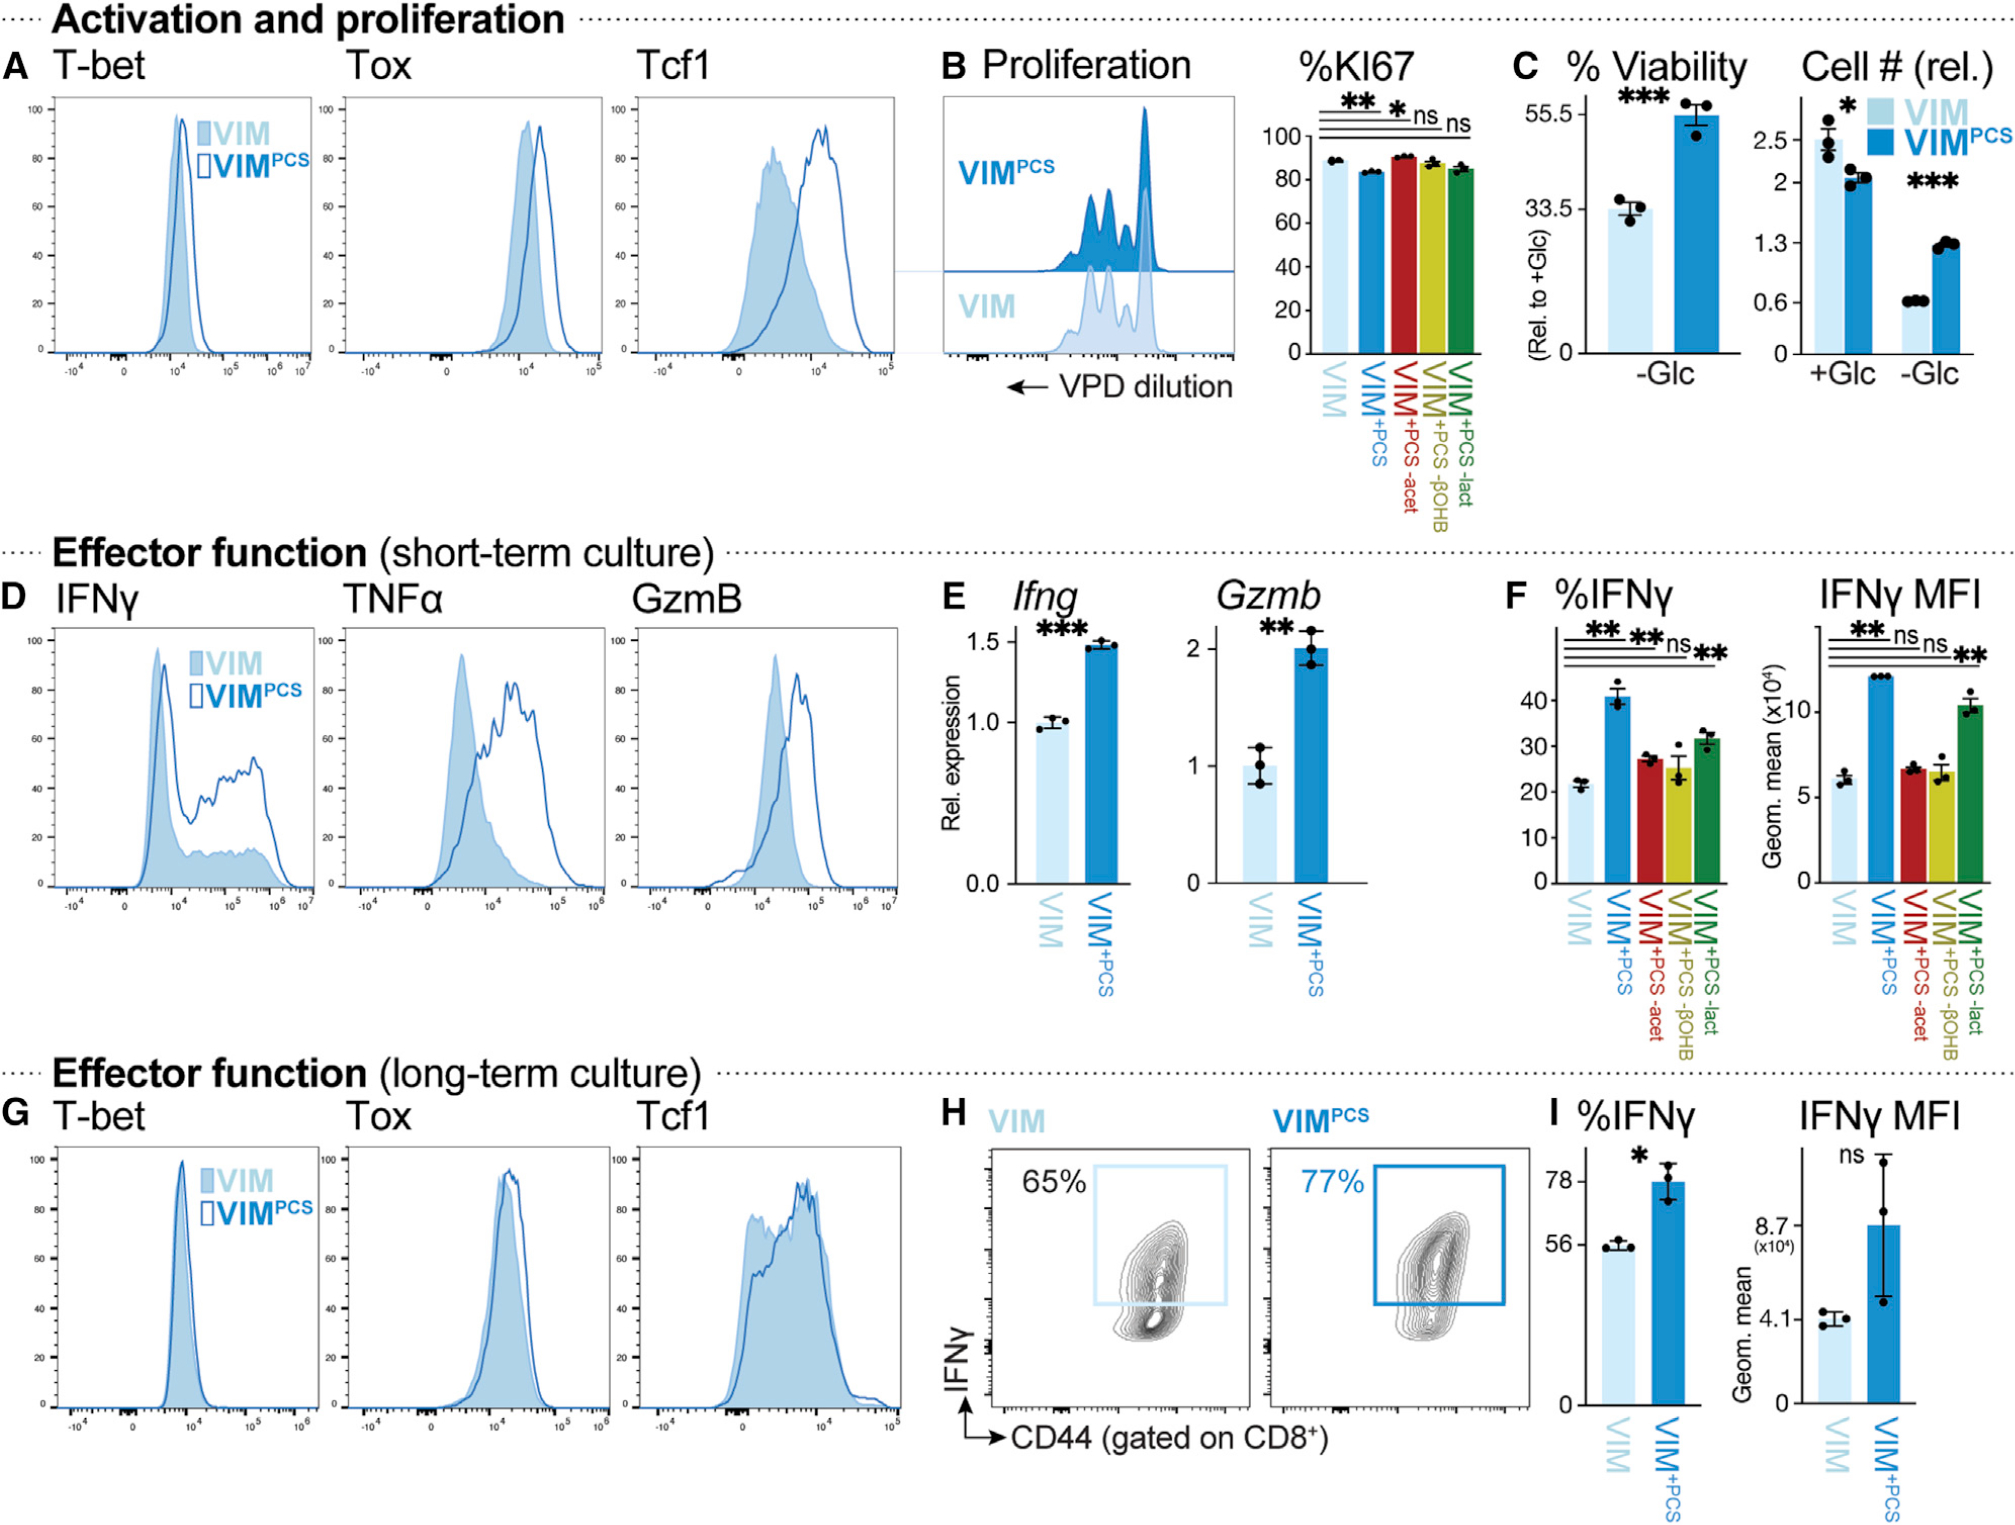
Figure 4. Physiologic carbon sources influence T cell survival and effector function.

(A) Histograms of T-bet, Tox, and Tcf1 expression in CD8+ T cells activated for 3 days with plate-bound anti-CD3 and -CD28 antibodies in VIM (closed) or VIMPCS (open).
(B) Proliferation of anti-CD3- and anti-CD28-stimulated CD8+ T cells cultured in VIM or VIMPCS for 3 days (n = 3/group). Left: violet proliferation dye (VPD) dilution. Right: percentage of Ki67+ CD8+ T cells after activation in VIM, VIMPCS, or VIM containing PCSs but lacking acetate (red), βOHB (yellow), or lactate (green).
(C) Cell viability (left) or cell number (right) of activated CD8+ T cells after 48 h of culture in VIM plus IL-2 and containing (+Glc) or lacking (−Glc) glucose. Percent viability was calculated relative to cell viability in glucose-replete conditions (5 mM) (mean ± SEM, n = 3/group). Cell number was expressed relative to initial cell number at day 0 (mean ± SEM, n = 3/group).
(D) Intracellular IFN-γ, TNF-α, and granzyme B levels in CD8+ T cells activated as in (A) (n = 3/group).
(E) Relative expression of Ifng and Gzmb mRNA in CD8+ T cells cultured as in (D) (mean ± SD, n = 3/group).
(F) Percentage of IFN-γ+ CD8+ T cells (left) and MFI for IFN-γ expression (right) for CD8+ T cells cultured as in (D) in VIM, VIMPCS, or VIM containing PCSs but lacking acetate, βOHB, or lactate (n = 3/group).
(G–I) CD8+ T cells were activated for 3 days with plate-bound anti-CD3 and -CD28 antibodies, followed by culture for an additional 4 days with IL-2, in VIM or VIMPCS. Analysis of CD8+ T cells was conducted on day 7.
(G) T-bet, Tox, and Tcf1 expression.
(H) Plot of CD44 versus intracellular IFN-γ expression.
(I) Percentage of IFN-γ+ CD8+ T cells and MFI for IFN-γ expression (mean ± SEM, n = 3/group).
