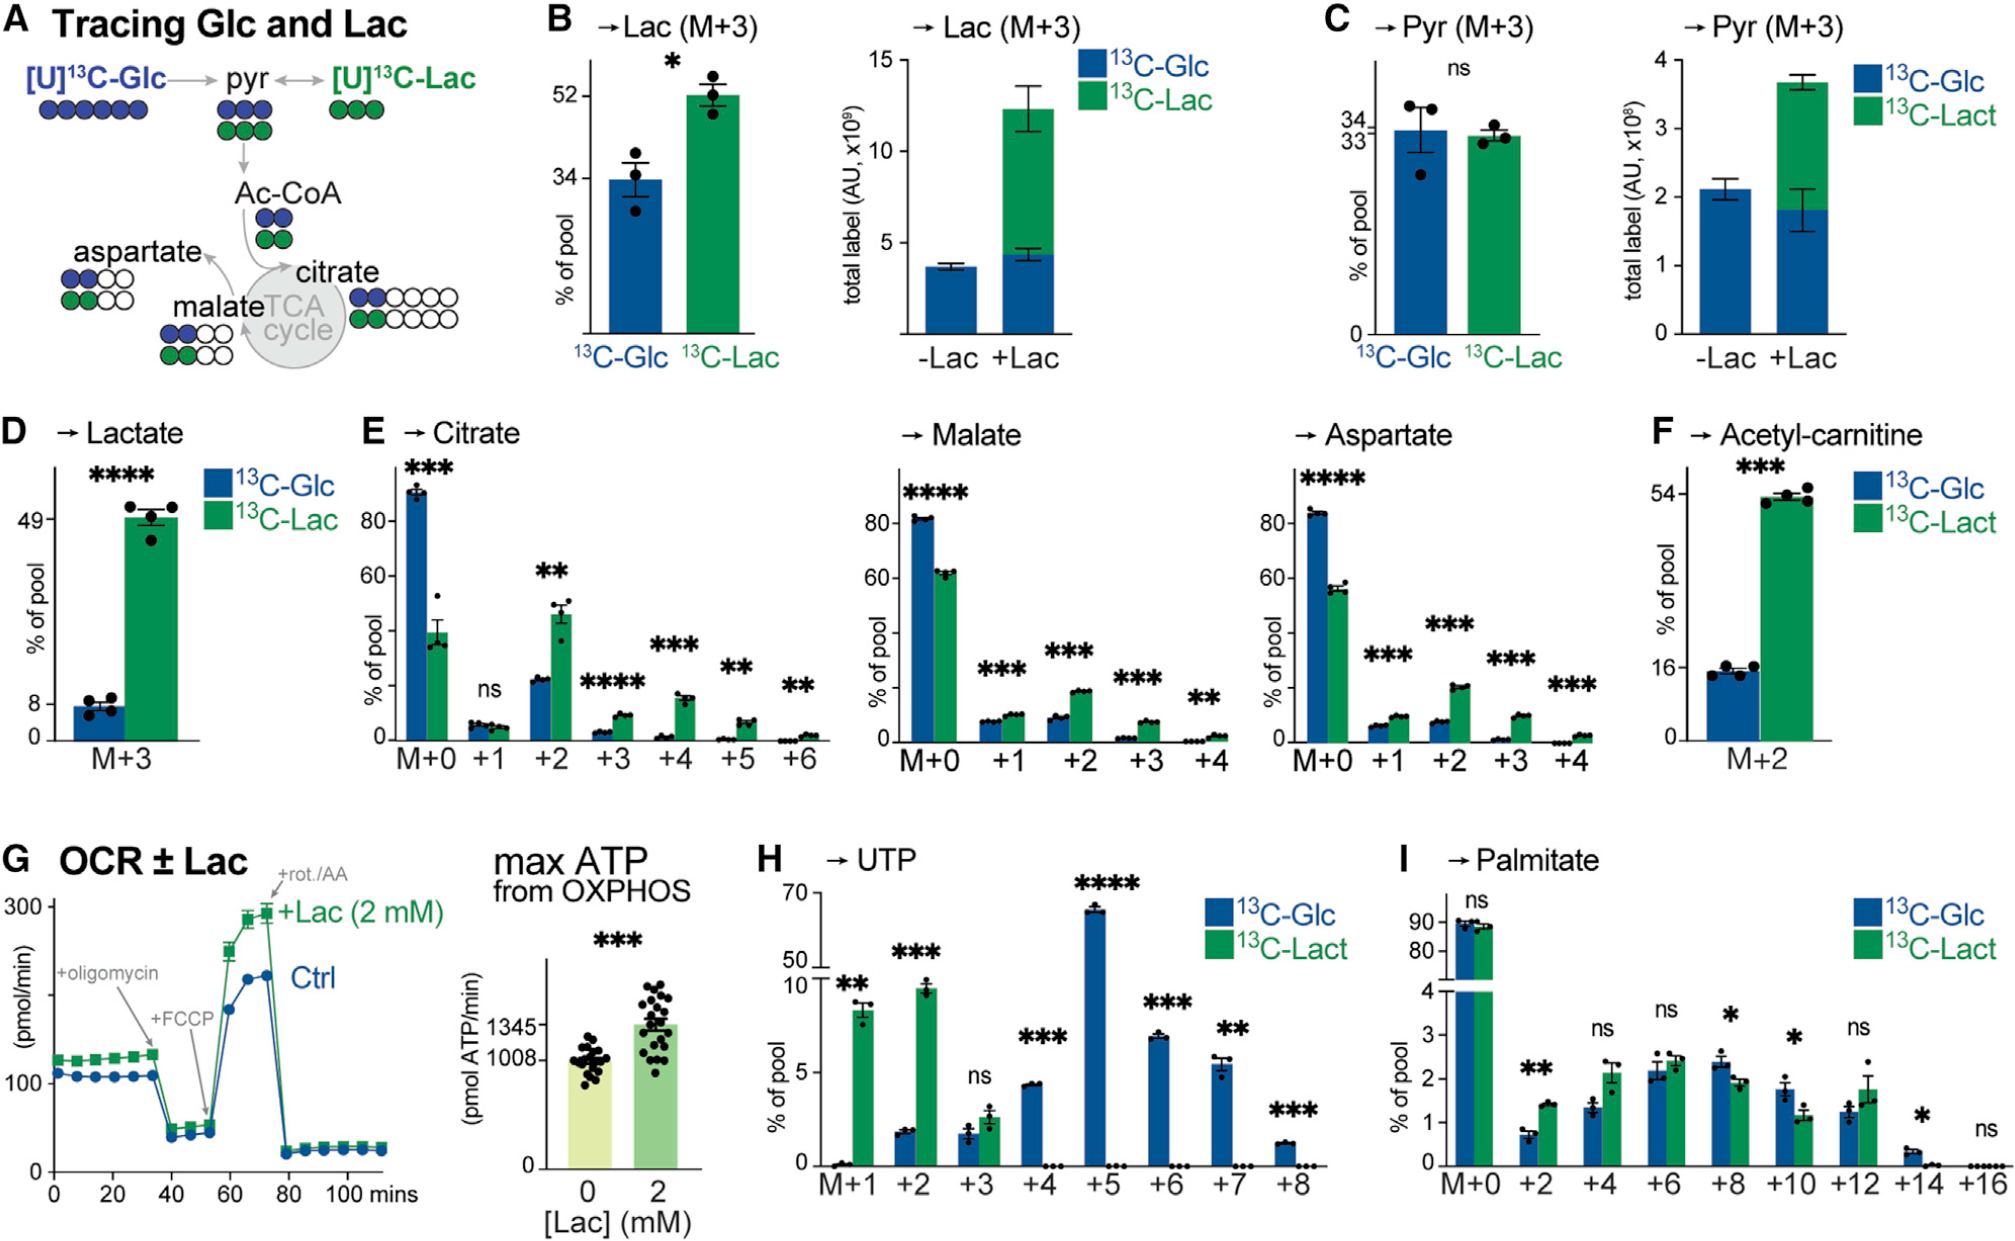
Figure 5. Lactate is a physiologic fuel for CD8+ T cells.

(A) Schematic of [U-13C]-glucose (blue) and [U-13C]-lactate (green) tracing into TCA cycle intermediates and TCA cycle-derived metabolites (i.e., aspartate).
(B) [U-13C]-glucose (5 mM) and [U-13C]-lactate (2 mM) labeling into lactate in activated CD8+ T cells after 4 h of culture (mean ± SEM, n = 3/group). Left: fractional enrichment of [U-13C]-glucose and [U-13C]-lactate carbon into the lactate pool. Right: total abundance of [U-13C]-glucose- or [U-13C]-lactate-derived lactate in activated CD8+ T cells cultured in VIM lacking (−) or containing (+) 2 mM lactate.
(C) [U-13C]-glucose and [U-13C]-lactate labeling into pyruvate for T cells cultured as in (B) (mean ± SEM, n = 3/group). Left: fractional enrichment of [U-13C]-glucose and [U-13C]-lactate carbon into the pyruvate pool. Right: total abundance of [U-13C]-glucose- or [U-13C]-lactate-derived pyruvate in T cells cultured without (−) or with (+) 2 mM lactate.
(D–F) Fractional enrichment of [U-13C]-glucose and [U-13C]-lactate in intracellular (D) lactate, (E) TCA cycle intermediates (citrate, malate, and aspartate), and (F) acetyl-carnitine in OT-I CD8+ T cells isolated from LmOVA-infected mice at 3 dpi. Isolated T cells were cultured ex vivo in VIM containing 5 mM glucose and 2 mM lactate (either 12C or 13C) for 4 h (mean ± SEM, n = 4/group).
(G) Bioenergetic profile of in vitro-activated CD8+ T cells cultured with no (Ctrl) or 2 mM lactate (+Lac) (mean ± SD, n = 20–22/group). Left: OCR plot for activated CD8+ T cells over time. Time of addition of oligomycin, fluoro-carbonyl cyanide phenylhydrazone (FCCP), and rotenone and antimycin A (rot./AA) are indicated. Right: maximal ATP production rates from OXPHOS.
(H and I) MID of [U-13C]-glucose and [U-13C]-lactate carbon in (H) UTP or (I) palmitate for in vitro-activated CD8+ T cells cultured in VIM for 4 h (H) or 24 h (I) (mean ± SEM, n = 3/group).
