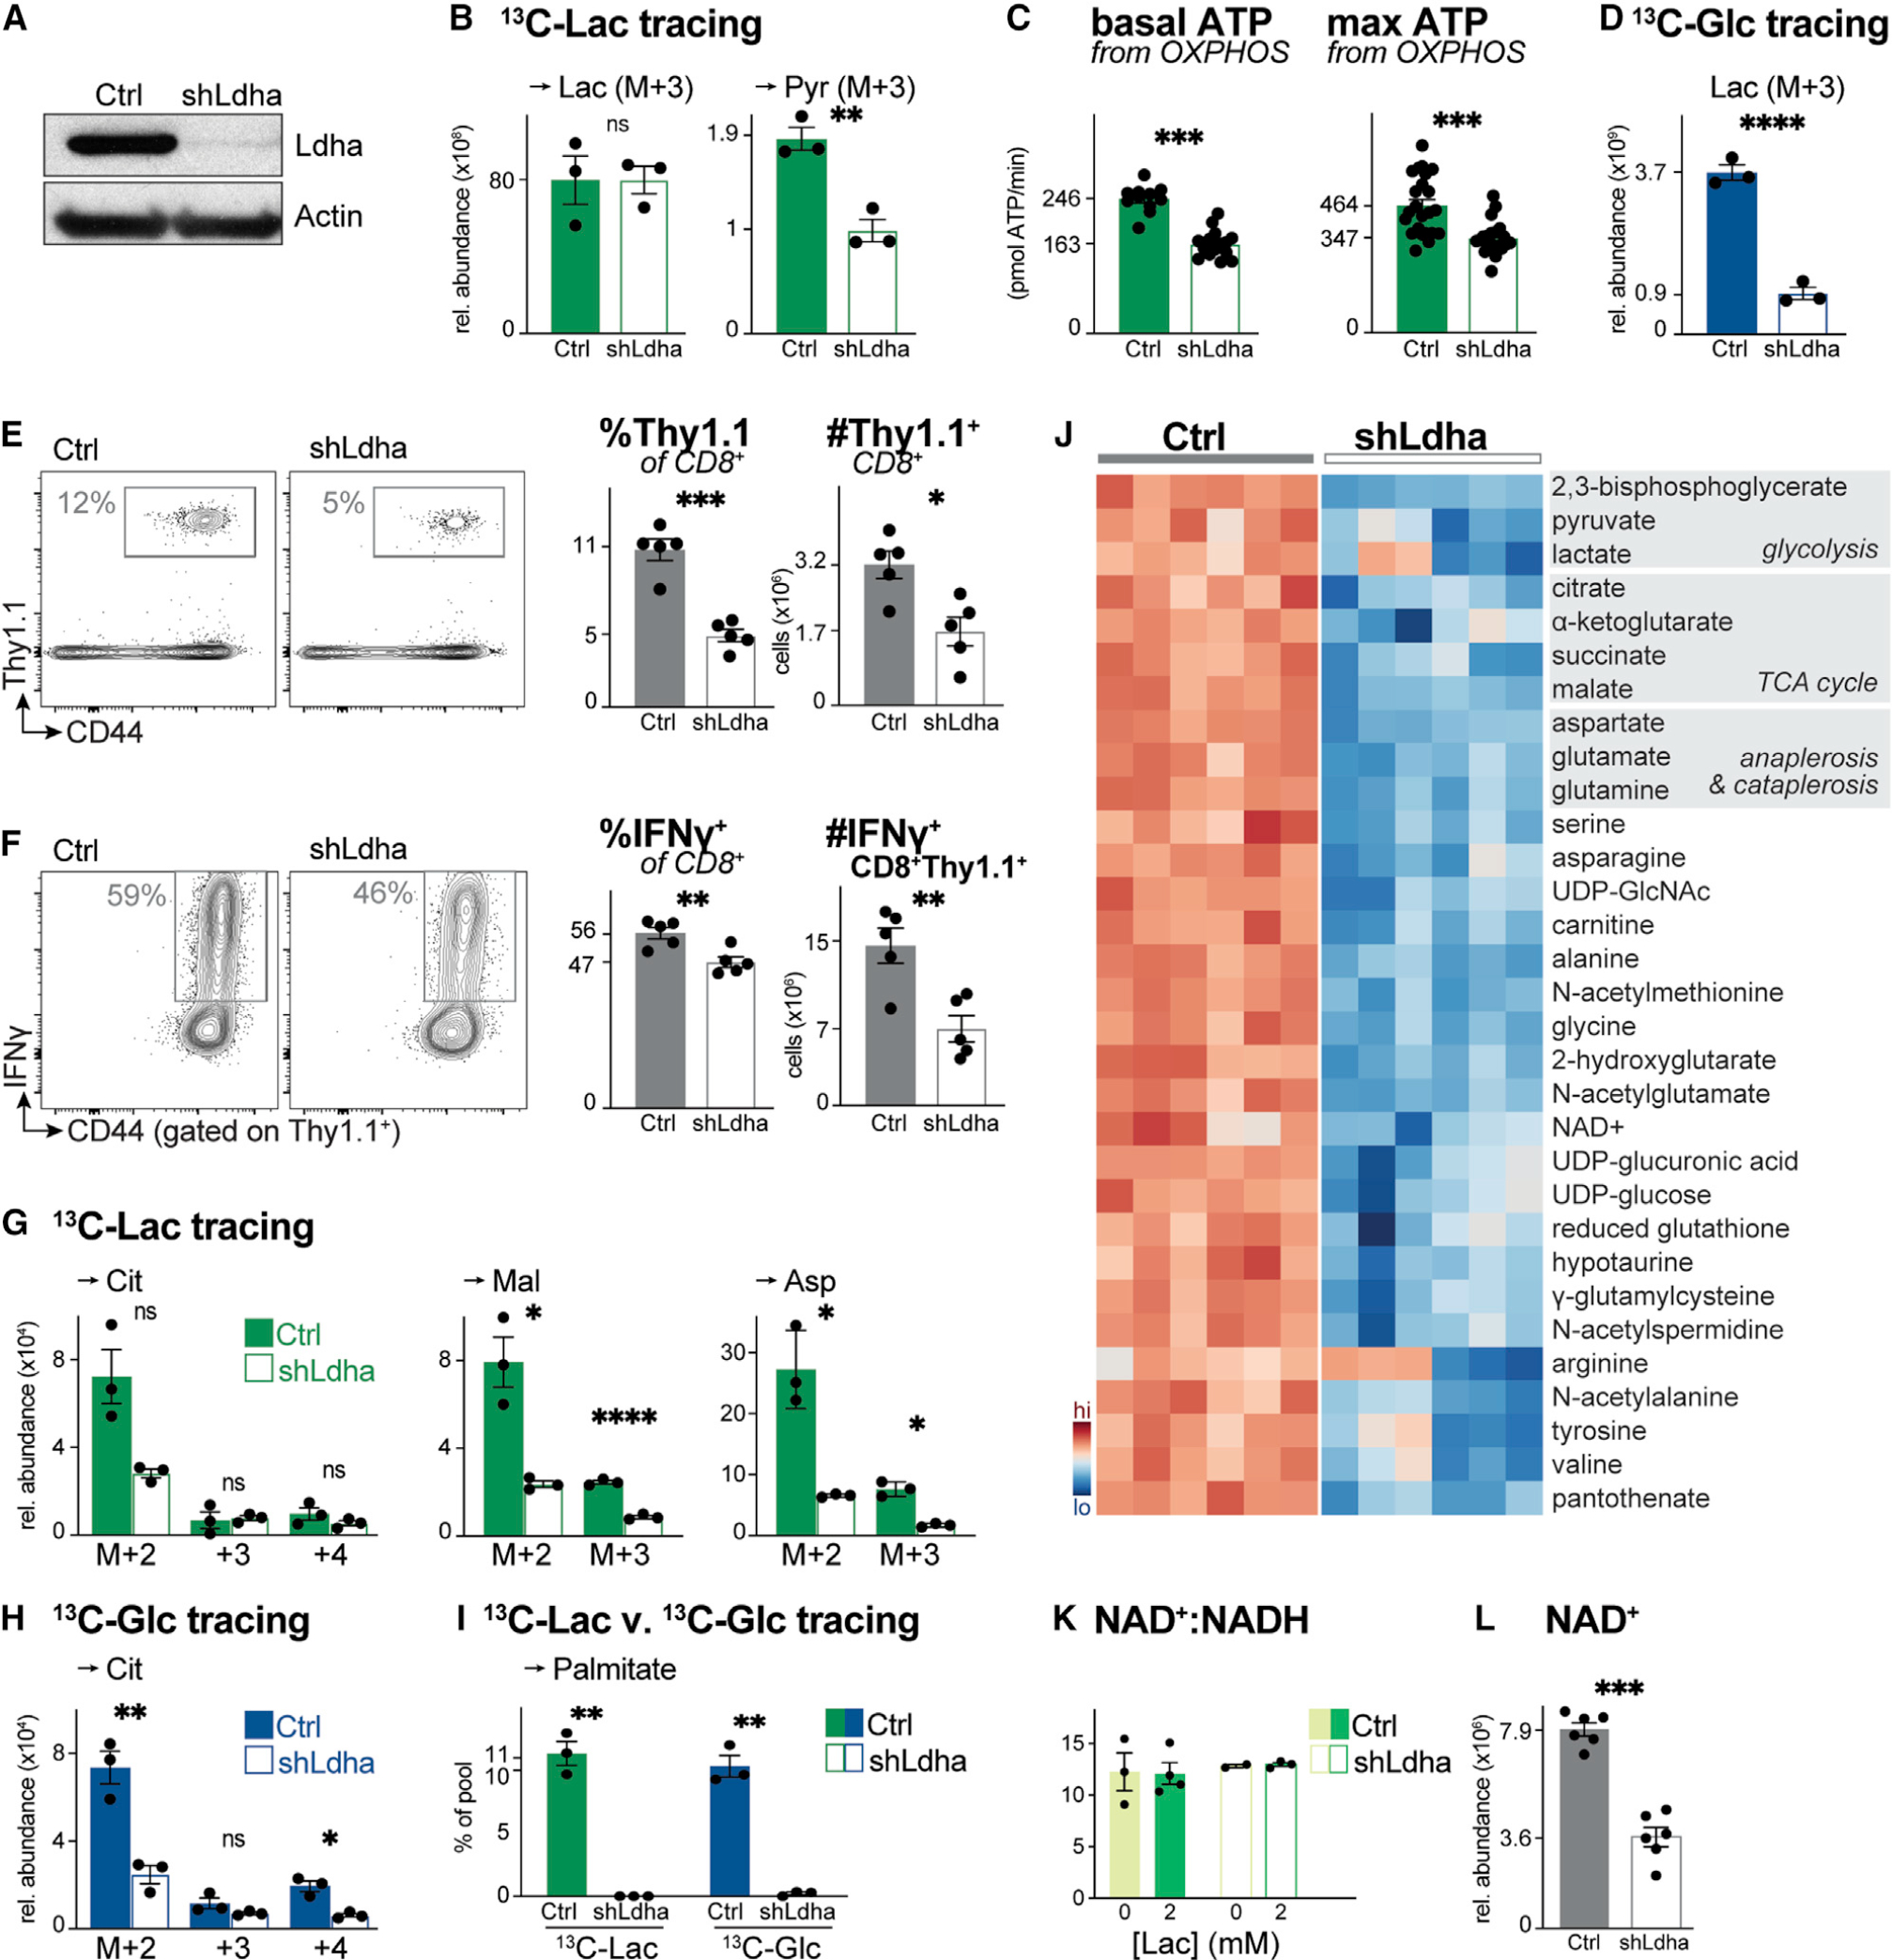
Figure 6. Ldha regulates T cell metabolism and effector cell expansion in vivo.

(A) Immunoblot of Ldha and actin protein levels in whole cell lysates from activated CD8+ T cells expressing a control (Ctrl) or Ldha-targeting (shLdha) shRNA.
(B) Relative abundance of intracellular [U-13C]-lactate-derived lactate (Lac) and pyruvate (Pyr) in activated CD8+ T cells expressing a control (Ctrl) or Ldha-targeting (shLdha) shRNA. T cells were cultured in VIM containing 5 mM glucose and 2 mM [U-13C]-lactate for 4 h (mean ± SEM, n = 3/group).
(C) Basal (left) and maximal (right) ATP production rates from OXPHOS for CD8+ T cells expressing a control (Ctrl) or Ldha-targeting (shLdha) shRNA cultured as in (B) (mean ± SD, n = 10–24/group).
(D) Relative abundance of intracellular [U-13C]-glucose-derived lactate (Lac) in control (Ctrl) or shLdha-expressing CD8+ T cells cultured with 5 mM [U-13C]-glucose and 2 mM lactate for 4 h (mean ± SEM, n = 3/group).
(E) Flow cytometry plots showing abundance of OVA-specific Thy1.1+ OT-I T cells in the spleen of LmOVA-infected mice 7 dpi. Right: percentage and total number of Thy1.1+ CD8+ OT-I T cells (mean ± SEM, n = 5 mice/shRNA).
(F) Flow cytometry plots showing the percentage of IFN-γ+ control (Ctrl) or shLdha-expressing Thy1.1+ CD8+ OT-I T cells in the spleen of LmOVA-infected mice 7 dpi. Right: percentage and total number of IFN-γ+ Thy1.1+ CD8+ T cells (mean ± SEM, n = 5 mice/shRNA).
(G and H) MIDs for indicated intracellular metabolites in activated control (Ctrl) or shLdha-expressing CD8+ T cells. Cells were cultured for 4 h in VIM containing (G) 2 mM [U-13C]-lactate and unlabeled 5 mM glucose or (H) 5 mM [U-13C]-glucose and unlabeled 2 mM lactate (mean ± SEM, n = 3/group).
(I) [U-13C]-lactate and [U-13C]-glucose labeling into palmitate (in VIM for 24 h) in activated CD8+ T cells expressing a control (Ctrl) or Ldha-targeting (shLdha) shRNA (mean ± SEM, n = 3/group).
(J) Heatmap depicting relative abundance of intracellular metabolites in activated control (Ctrl) or shLdha-expressing CD8+ T cells following 4 h culture in VIM. Shown are the top 45 significant metabolites (p < 0.05) based on differential metabolite levels between groups (n = 6/group).
(K) NAD+:NADH ratio for control (Ctrl) or shLdha-expressing CD8+ T cells cultured for 2 h in VIM containing 0 or 2 mM sodium lactate (n = 2–4/group).
(L) NAD+ abundance in activated CD8+ T cells expressing a control (Ctrl) or Ldha-targeting (shLdha) shRNA following 4 h culture in VIM (mean ± SEM, n = 6/group).
