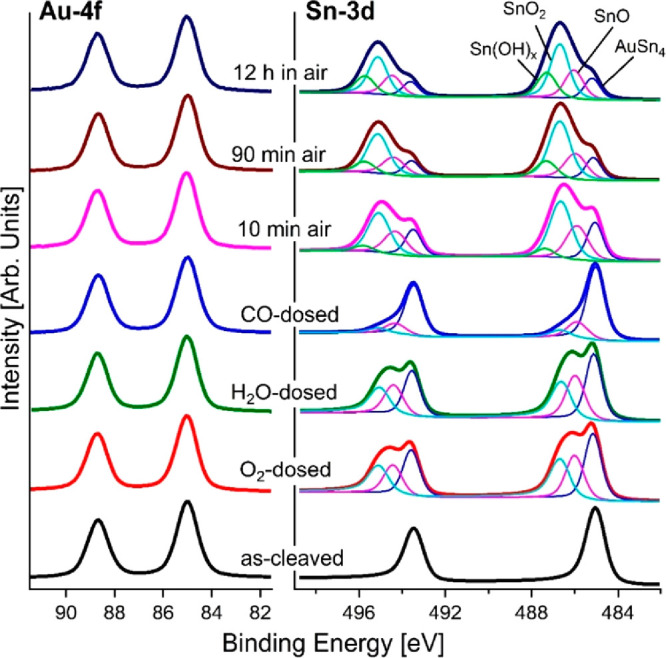
Figure 5.

Core-level spectra of Au-4f and Sn-3d collected from as-cleaved AuSn4 (black curve) and from the same surface exposed to O2 (red curve), H2O (green curve), and CO (blue curve). The AuSn4 surface was also kept in air for different times: 10 min (pink curve), 90 min (brown curve), and 12 h (dark blue curve). The photon energy is 900 eV, and the spectra are normalized to the maximum.
