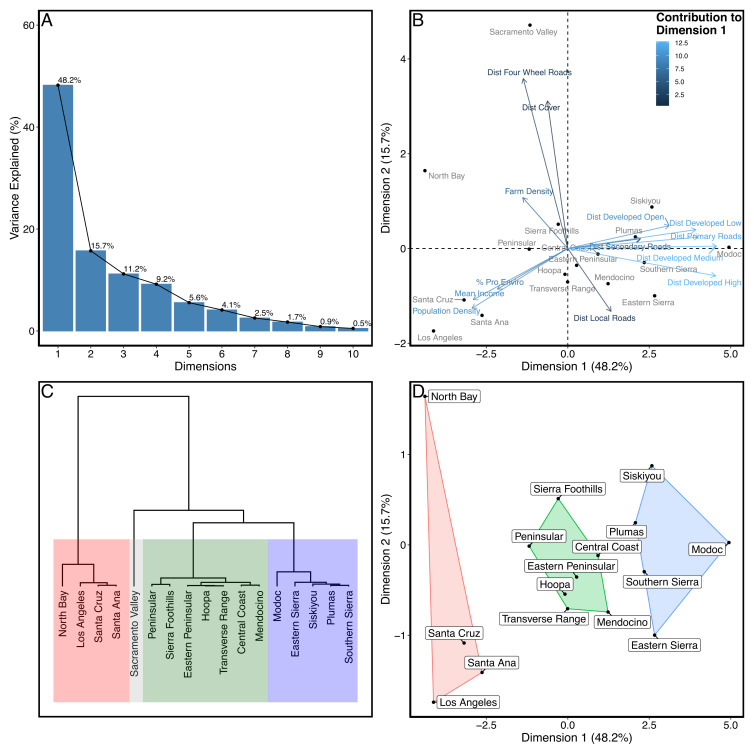
Fig. 3.
Principal components analysis (PCA) plots for landscape features and characteristics of human populations associated with mountain lion (n = 389) GPS telemetry locations across California. Shown are the percentage of variance explained by each dimension (A), contribution to variation in landscape and human populations of first dimensions of PCA (B), a dendrogram identifying 4 clusters of study areas with similar characteristics (C), and a plot showing the 3 main clusters of study areas identified with the PCA (D).

