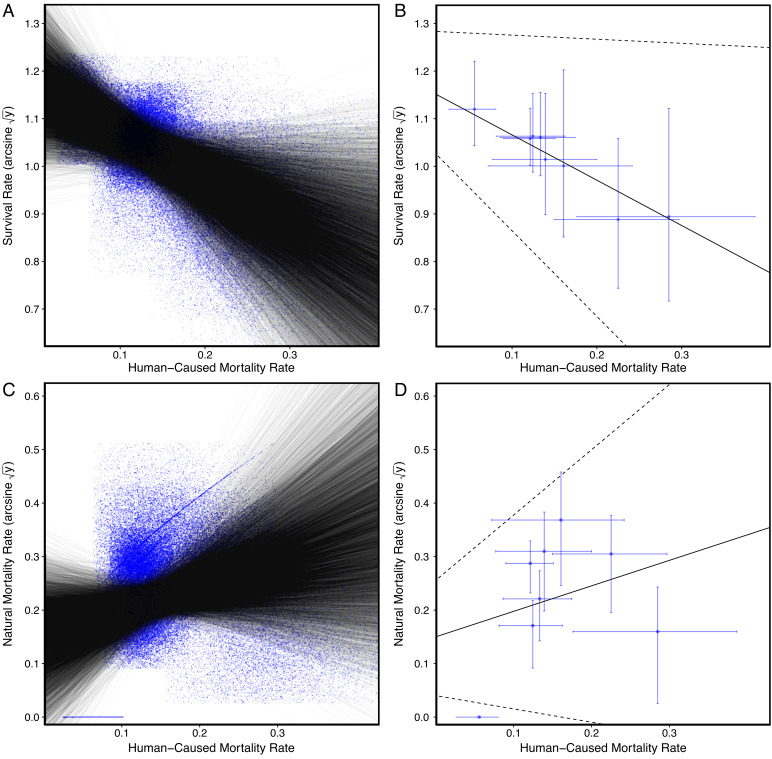
Fig. 4.
Plots showing relationships of overall survival and human-caused mortality (A and B) and natural mortality and human-caused mortality (C and D) across 8 study areas (n = 431 mountain lions) to test the compensatory mortality hypothesis. Shown are data points and regression lines (A and C) generated by drawing 10,000 samples from beta distributions to account for uncertainty in our estimates and regression plots used to estimate mean β and 90% highest posterior density intervals for these relationships (B and D).

