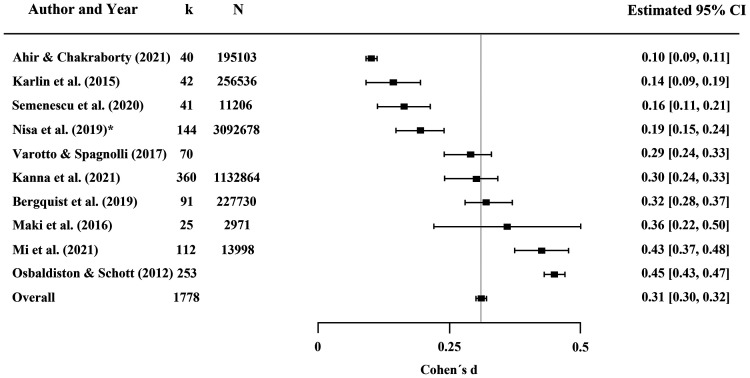
Fig. 1.
Forest plot of the mean overall unadjusted effect sizes of the included meta-analyses. Note. k = number of studies, N = number of participants, dotted line = overall effect, Estimate (95% CI) = estimate and 95% CIs. *The effect size from Nisa et al. (19) is based on the restricted maximum likelihood estimator, as reported by van der Linden and Goldberg (26).

