Figure 3.
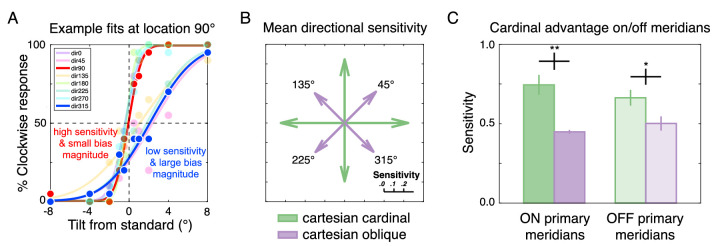
Sensitivity estimates demonstrate a cartesian cardinal advantage. (A) Example psychometric fits for S01 at location 90 degrees demonstrates high sensitivity and small bias magnitude (red curve/text) for upward compared to low sensitivity and high bias magnitude (blue curve/text) for upper leftward motion directions at this location. Each curve was estimated from 200 trials (20 trials/tilt angle). At this location, sensitivity to upwards directions = 0.97 (units: 1/degrees) and bias magnitude = 0.07 (units: degrees); sensitivity to lower rightwards directions = 0.53 and bias magnitude = 2.10. (B) Mean sensitivity (represented by arrow length) for each motion direction collapsed across all eight locations. Sensitivity was greater for cartesian cardinal than cartesian oblique directions. (C) Mean sensitivity to cartesian cardinal and cartesian oblique directions grouped based on whether the stimulus was located ON or OFF the primary meridians of the visual field. Grouping the data this way shows that the cartesian cardinal advantage was greater on than off the primary meridians.

