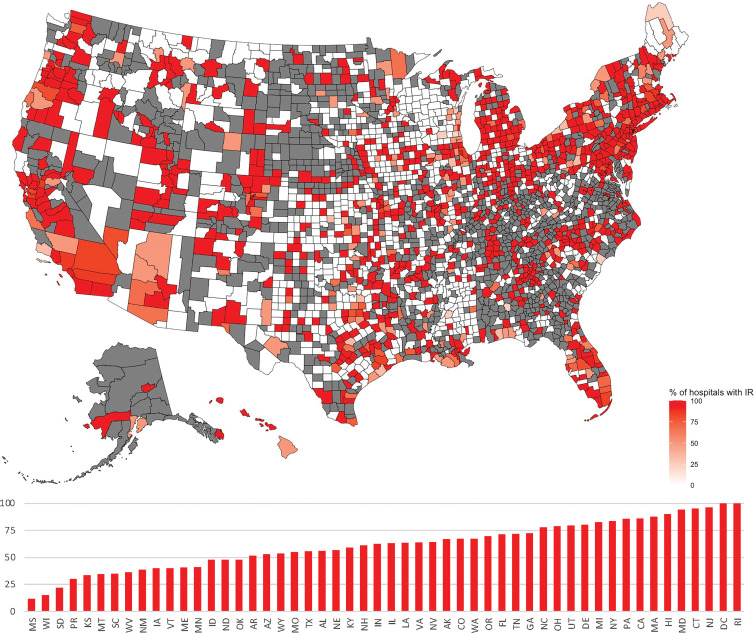
Intensity map shows the percentage of hospitals reporting availability of interventional radiology (IR) facilities and services according to county and state. Counties shaded in gray did not have any hospitals present in the sample. Counties in white had at least one hospital in the sample, none of which reported owning IR facilities and services. Increasing opacity denotes a higher percentage of hospitals reporting the availability of IR facilities and services. The bar graph presents the percentage of hospitals that reported IR as available by state and/or territory.

An official website of the United States government
Here's how you know
Official websites use .gov
A
.gov website belongs to an official
government organization in the United States.
Secure .gov websites use HTTPS
A lock (
) or https:// means you've safely
connected to the .gov website. Share sensitive
information only on official, secure websites.
