. 2022 Dec 20;307(1):e220715. doi: 10.1148/radiol.220715

Figure 3:

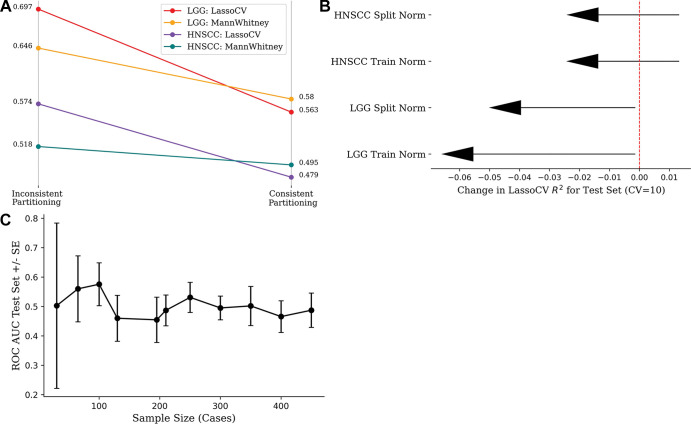
(A) Strip chart shows mean accuracy loss from changing inconsistent partitioning (data set normalization and feature selection) to consistent partitioning (train normalization and feature selection) in 100 replicates. (B) Lollipop plot shows loss of mean model efficiency (LassoCV R2) over 100 iterations after changing from inconsistent to consistent partitioning. (C) Line chart shows effect of sample size on model performance, keeping number of radiomics features (10 features) and method of feature selection constant. Wide CIs are seen at low sample sizes because choice of data partition drastically alters the distribution of features in each partition. Performance plateaus at the area under the receiver operating characteristic curve (ROC AUC) value of 0.5 because the features and label are randomly generated. CV = cross validation, HNSCC = head and neck squamous cell carcinoma, LGG = low-grade glioma, SE = standard error.

(A) Strip chart shows mean accuracy loss from changing inconsistent partitioning (data set normalization and feature selection) to consistent partitioning (train normalization and feature selection) in 100 replicates. (B) Lollipop plot shows loss of mean model efficiency (LassoCV R2) over 100 iterations after changing from inconsistent to consistent partitioning. (C) Line chart shows effect of sample size on model performance, keeping number of radiomics features (10 features) and method of feature selection constant. Wide CIs are seen at low sample sizes because choice of data partition drastically alters the distribution of features in each partition. Performance plateaus at the area under the receiver operating characteristic curve (ROC AUC) value of 0.5 because the features and label are randomly generated. CV = cross validation, HNSCC = head and neck squamous cell carcinoma, LGG = low-grade glioma, SE = standard error.