. 2022 Dec 20;307(1):e220715. doi: 10.1148/radiol.220715

Figure 5:

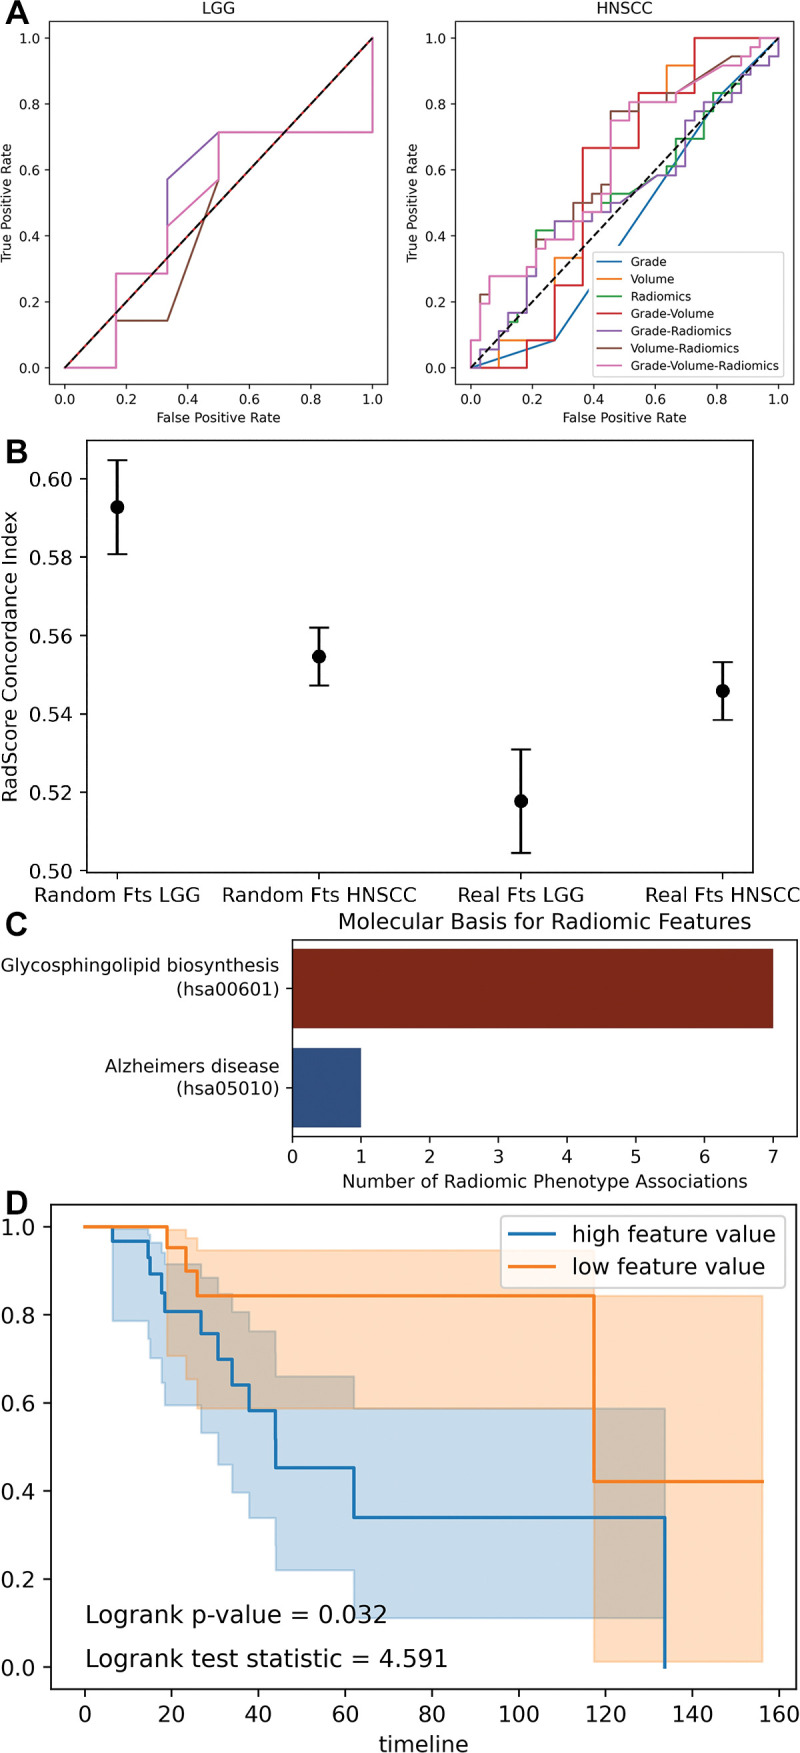
Combination of radiomics and biologic variables. (A) Receiver operating characteristic curves show support vector machine models fit to combinations of radiomics and biologic variables. (B) Dot plot with error bars show concordance index for radiomics score (RadScore) in Cox proportional hazards models. A concordance index of 0.5 represents random chance. The random radiomics features have higher concordance with true outcome (overall survival) than the authentic features. (C) Bar chart shows significant associations (Pearson) between random radiomics features and authentic gene ontology pathways in The Cancer Genome Atlas Low-Grade Glioma data set. (D) Kaplan-Meier curves show overall survival split by median feature value of a random feature observed to be spuriously yet significantly correlated with glycosphingolipid biosynthesis gene ontology pathway. Fts = features, HNSCC = head and neck squamous cell carcinoma, LGG = low-grade glioma.

Combination of radiomics and biologic variables. (A) Receiver operating characteristic curves show support vector machine models fit to combinations of radiomics and biologic variables. (B) Dot plot with error bars show concordance index for radiomics score (RadScore) in Cox proportional hazards models. A concordance index of 0.5 represents random chance. The random radiomics features have higher concordance with true outcome (overall survival) than the authentic features. (C) Bar chart shows significant associations (Pearson) between random radiomics features and authentic gene ontology pathways in The Cancer Genome Atlas Low-Grade Glioma data set. (D) Kaplan-Meier curves show overall survival split by median feature value of a random feature observed to be spuriously yet significantly correlated with glycosphingolipid biosynthesis gene ontology pathway. Fts = features, HNSCC = head and neck squamous cell carcinoma, LGG = low-grade glioma.