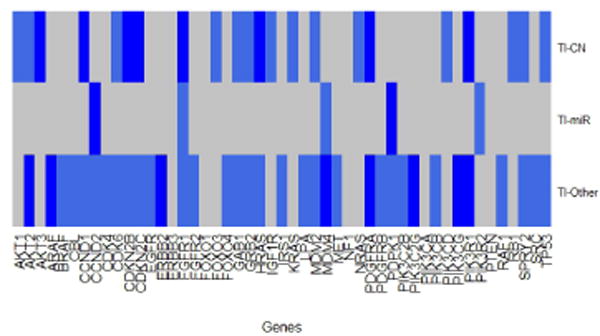
Fig. 1.

T1 significant importance “probability” heatmap plot. A gene is consider significant if the “probability” of being chosen is greater than 0.5. The gray shaded markers are the genes that are not significant and the blue shaded markers are the significant genes.
