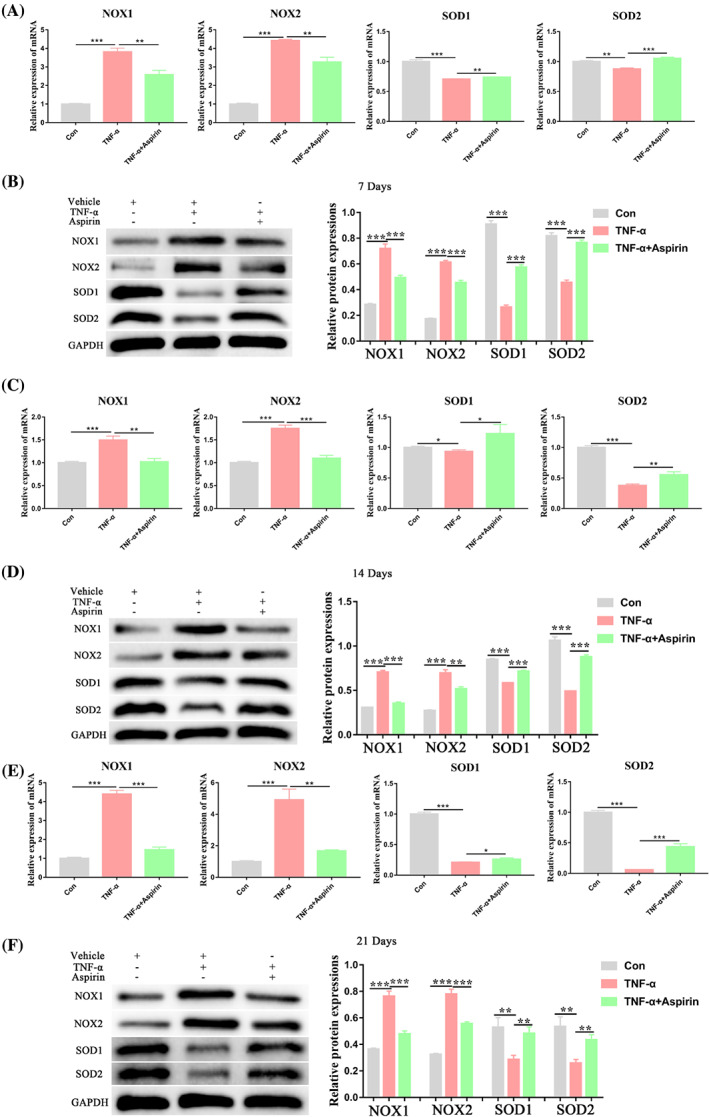
FIGURE 5.

Impact of TNF‐α and aspirin on oxidative stress markers expression during chondrogenesis of BMMSCs. (A, B) Relative mRNA and protein expression levels of oxidative stress markers (NOX1, NOX2, SOD1, and SOD2) were measured in BMMSCs treated with or without TNF‐α and aspirin for 7 days by qRT‐PCR and western blot analyses, respectively. (C, D) Relative mRNA and protein expression levels of oxidative stress markers (NOX1, NOX2, SOD1, and SOD2) were measured in BMMSCs treated with or without TNF‐α and aspirin for 14 days by qRT‐PCR and western blot analyses, respectively. (E, F) Relative mRNA and protein expression levels of oxidative stress markers (NOX1, NOX2, SOD1, and SOD2) were measured in BMMSCs treated with or without TNF‐α and aspirin for 21 days by qRT‐PCR and western blot analyses, respectively. Data in (A), (C), and (E) are given as the mean ± SD of three independent experiments. GAPDH, glyceraldehyde‐3‐phosphate dehydrogenase; NOX1, NADPH oxidase 1; NOX2, NADPH oxidase 2; SOD1, superoxide dismutase 1; SOD2, superoxide dismutase 2. *p < 0.05, **p < 0.01, ***p < 0.001
