Figure 2.

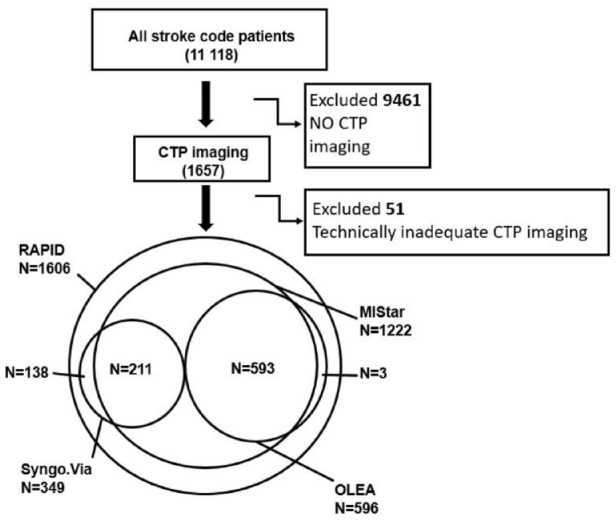
Flowchart of the patients in study including a Venn diagram of RAPID cohort and MIStar, OLEA and Syngo.Via cohorts. CTP: computed tomography perfusion imaging.

Flowchart of the patients in study including a Venn diagram of RAPID cohort and MIStar, OLEA and Syngo.Via cohorts. CTP: computed tomography perfusion imaging.