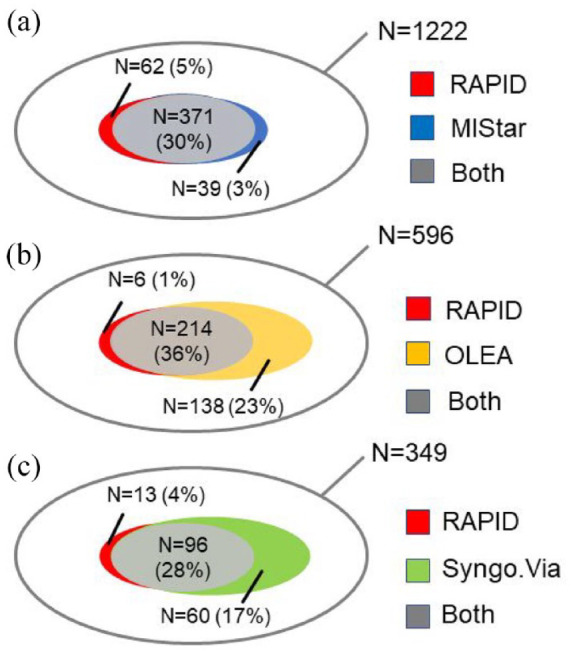
Figure 3.

Venn diagram showing the proportion of patients who fulfill the target mismatch definition by each automated imaging analysis software. Target mismatch is defined as (a) volume of perfusion lesion divided by ischemic core volume (mismatch ratio) ⩾1.8, (b) a perfusion lesion volume of ⩾15 mL, and (c) a ischemic core volume less <70 mL by each software. The outer (gray) shell represents the compared cohort. Overlapping gray areas represent patients in whom both software classified a target mismatch. The non-overlapping color indicates the proportion of target mismatch found by one software but not the other.
