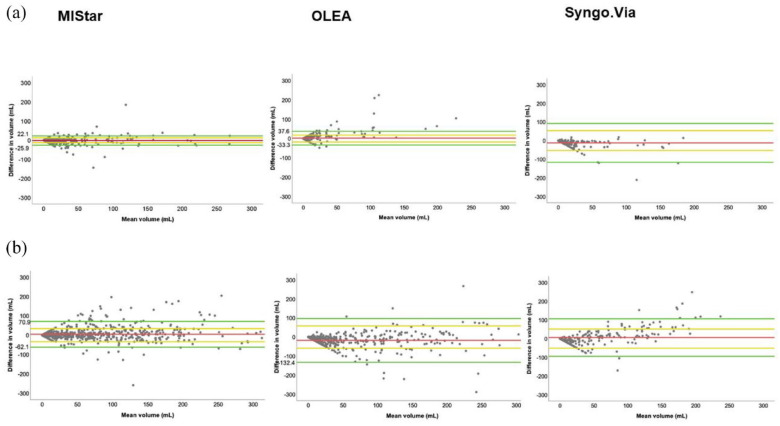
Figure 4.
Bland-Altman plots of the differences in ischemic core volume (a) and in perfusion lesion volume (b) between MIStar, OLEA, and Syngo.Via software and RAPID software showing mean volume (milliters, mL) of two software in the x-axis and difference in volume in the y-axis (mL).
The green horizontal lines above and below the difference line (red) represent 95% limits of agreement (confidence interval) of core volume and perfusion lesion volume and are defined with limits of agreement = difference ± 1.96 SD which is illustrated as yellow lines (±1 SD).
For illustrative reasons, the difference in volume between RAPID and other software is limited to ±300 mL for core and perfusion lesion volume. The number of patients with more than ±300 mL difference not shown in Figure 4 but provided in Supplemental Material with whole scale are as follows; ischemic core volume (None with MIStar and OLEA and two with Syngo.Via software) and perfusion lesion volume (Two patients with MIStar and Syngo.Via and five with OLEA software).

