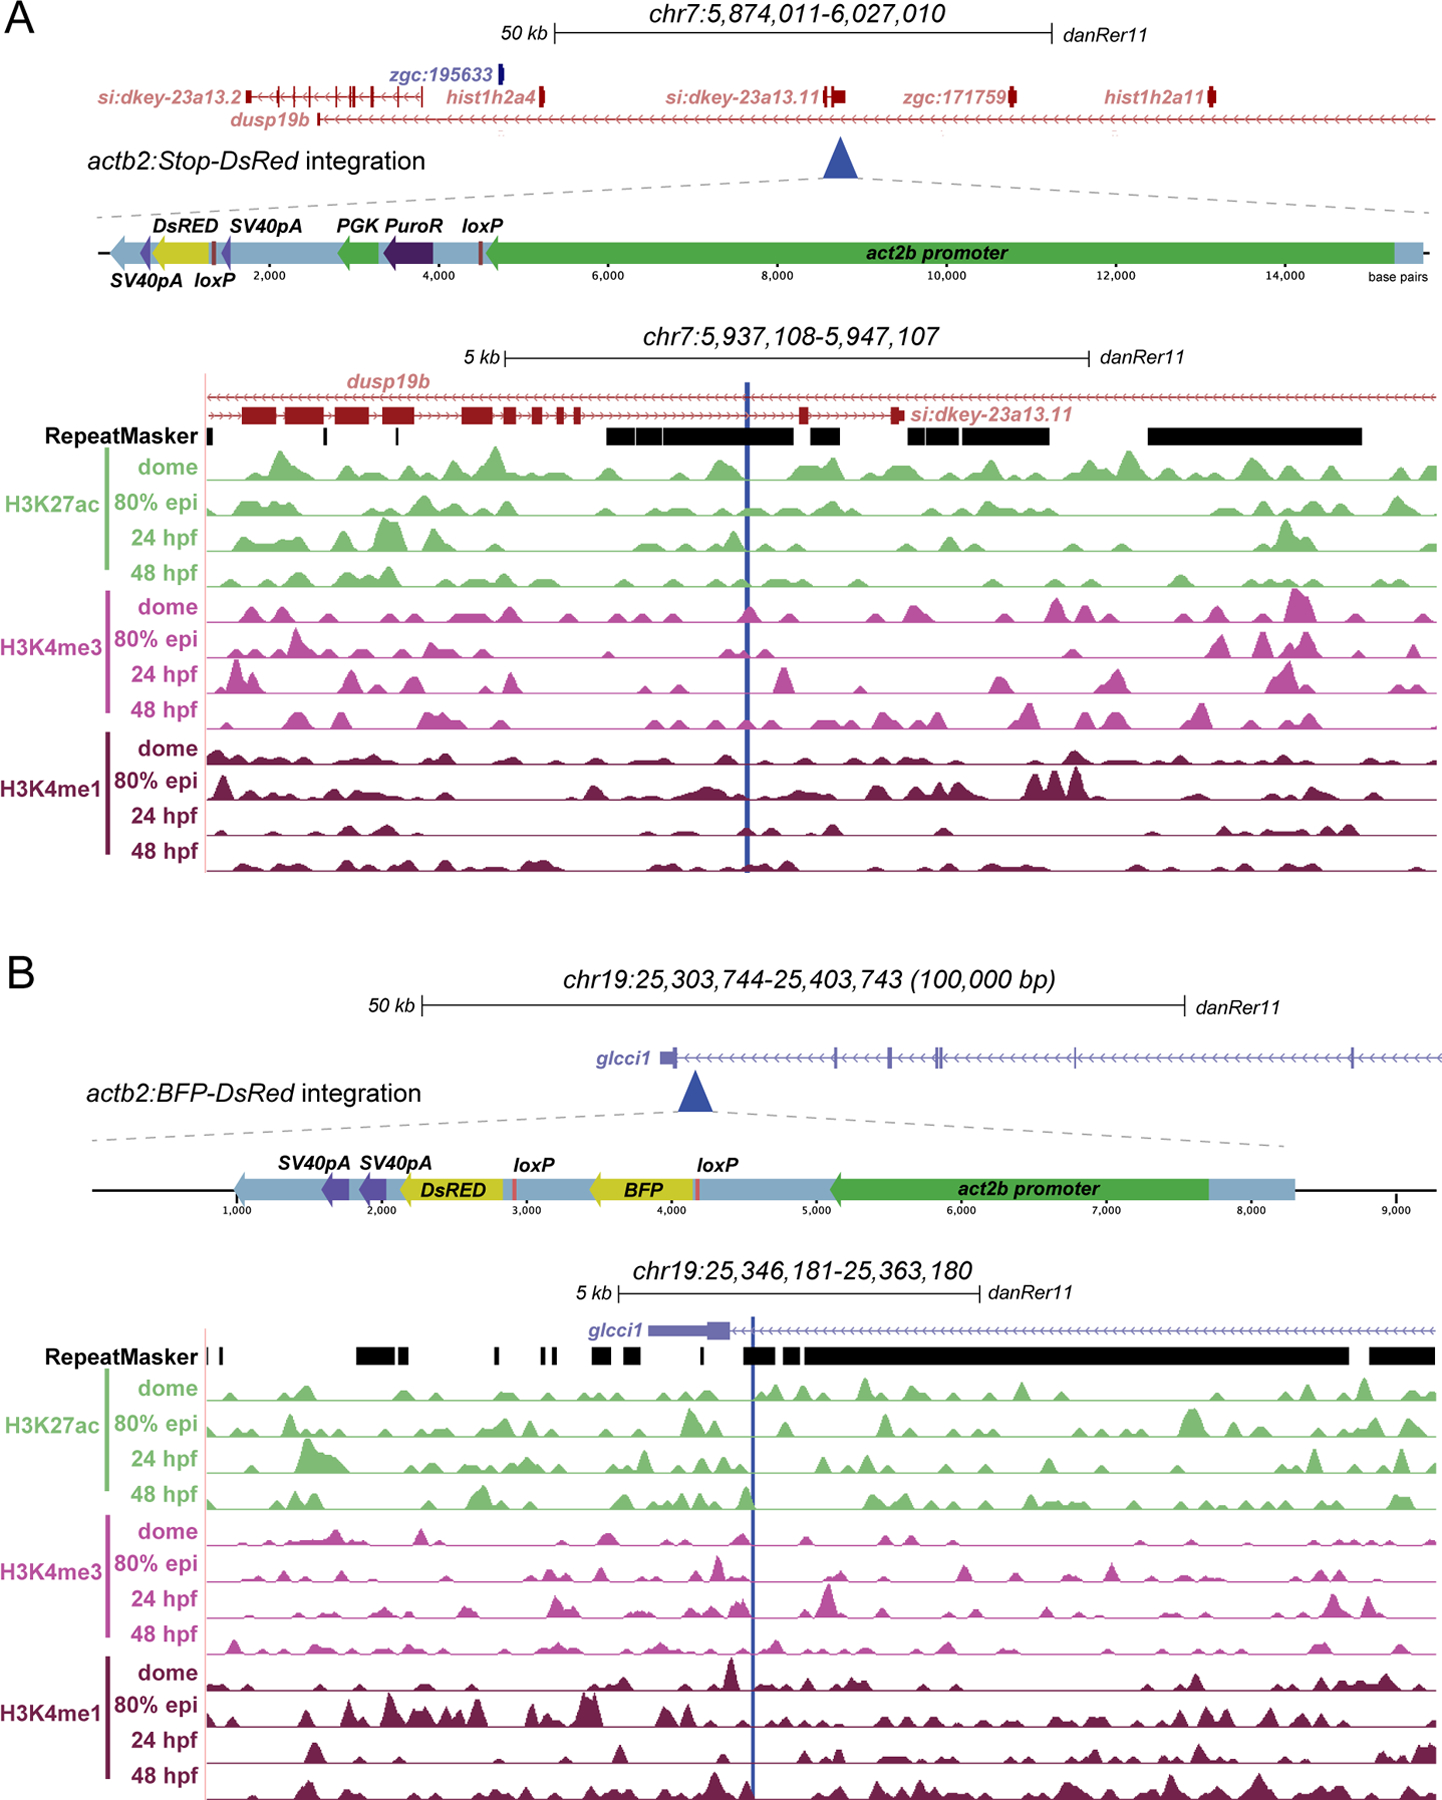
Figure 6. Transgene mapping reveals genomic features of the tested actb2-based Switch transgenes.

(A,B) Genomic integration sites of actb2-Stop-DsRed and actb2:BFP-DsRed determined by Thermal Asymmetric Interlaced (TAIL)-PCR. For each transgene, the integration site is displayed in UCSC genome browser, a schematic of the transgene is depicted, the integration site is aligned to RepeatMasker track, and ChIP-seq tracks for active chromatin marks at key developmental stages (A,B). Note the intronic integration sites for both transgenes and the absence of concise active chromatin marks compared to ubi:Switch and hsp70l:Switch.
