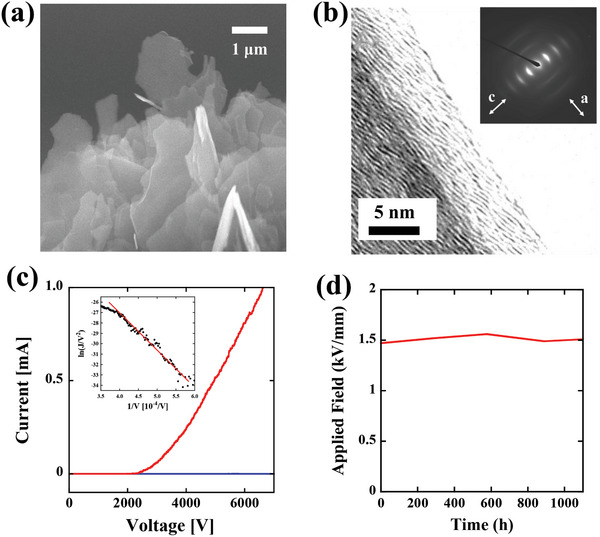
Figure 2.

a) SEM image of the microstructure of the GN cold cathode. b) HR‐TEM image of the GN cathode. The inset shows the diffraction patterns. c) Current–voltage (J–V) characteristics of the GN cathode plotted by the red line. As a comparison, the J–V characteristics of the bare graphite rod are also plotted by the blue line. The inset shows the Fowler–Nordheim plot for the J–V characteristics of the GN cathode by setting the horizontal axis as 1/V and the vertical axis as ln (J/V 2). d) Lifetime test of the GN cold cathode for 1000 h.
