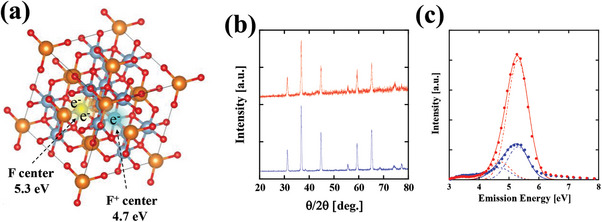
Figure 3.

a) Images of the F‐center (yellow cloud) and F+‐center (green cloud) wavefunctions at the oxygen‐removed defect states. The defect states are filled with two (F‐centers, 5.3 eV) or one (F+‐centers, 4.7 eV) electron. b) X‐ray diffraction patterns of the synthesized phosphor (red line) and a reference MgAl2O4 spinel crystalline powder (blue line). c) CL spectrum of the synthesized MgAl2O4 phosphors (red circles) and that of the reference MgAl2O4 powder (blue circles) with the emission peak at 5.3 eV (230 nm) and full width at half maximum (FWHM) of 0.8 eV (30 nm). Here, the CL spectra were obtained by a 50 µA total current‐accelerated 25 kV electron beam. The experimentally observed CL spectra were fitted by two Gaussian functions with the peak energies of the F‐centers and F+‐centers. Both Gaussian functions are assumed to have the same energy width of 0.5 eV (FWHM). For the synthesized phosphor, the height of the F‐center is fitted by 2000 (red broken line) and that of the F+‐center is fitted by 300 (red dotted line). For the reference powder, the height of the F‐center is fitted by 550 (blue broken line) and that of the F+‐center is fitted by 300 (blue dotted line). The solid red and blue lines represent the sums of the theoretical F‐ and F+‐center curves.
