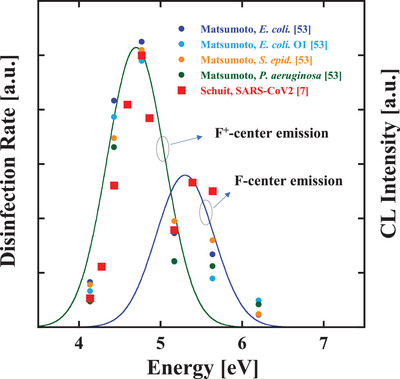
Figure 5.

Superposition of F+‐center emission spectrum (green line: the peak energy of 4.7 eV and an FWHM of 0.5 eV), F‐center emission (blue line: the peak energy of 5.3 eV and an FWHM of 0.5 eV), and the previously reported disinfection rate constants of E. coli DH5α (blue circles), E. coli O1 (light blue circles), Pseudomonas aeruginosa (green circles), Staphylococcus epidermidis (orange circles) obtained by Matsumoto et al.,[ 53 ] and SARS‐CoV‐2 (red squares) obtained by Schuit et al.[ 7 ]
