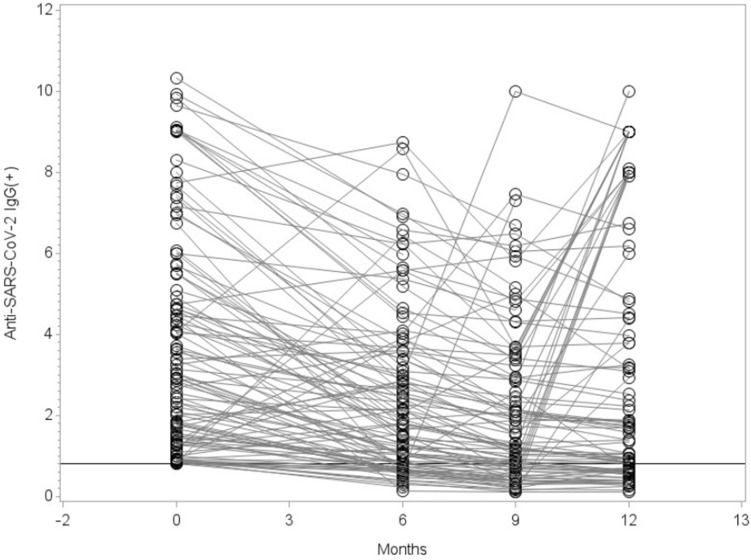
Figure 5.
IgG levels over time of participants who were IgG(+) at baseline and participated at least in one of the three follow-up visits (6, 9, and 12 months after our previous study in April 202021) were analyzed. Time point 0 months refers to the published data values of the original study. 27 participants who developed IgG values below the ratio of 0.8 (Limit of Quantification) were considered as seroreversed. Statistical significance was assessed using Wilcoxon sign-rank test and the resulting six p-values were adjusted for multiple testing following the Bonferroni-Holm procedure. Visit 1 vs. 0: p < 0.0001; Visit 2 vs. 0: p < 0.0001; Visit 3 vs. 0: p = 0.0016; Visit 1 vs. 2: p < 0.0001; Visit 1 vs. 3: p = 0.0053; Visit 2 vs. 3: p < 0.0001. All comparisons show a decreasing trend with time. It is important to note, that although the graph only shows those with IgG ratio ≥ 0.8 at visit 0, all subjects who contribute data for visit 0 and at least one of the following visits are included in the test (without restriction at visit 0). In addition, we excluded IgG values from participants who had received at least one dose of SARS-CoV-2 vaccine (Visit 2: n = 15, Visit 3: n = 46). This is because the ELISA we used is specific for SARS-CoV-2 spike protein, making it impossible to distinguish between an IgG response to natural infection or vaccination.

