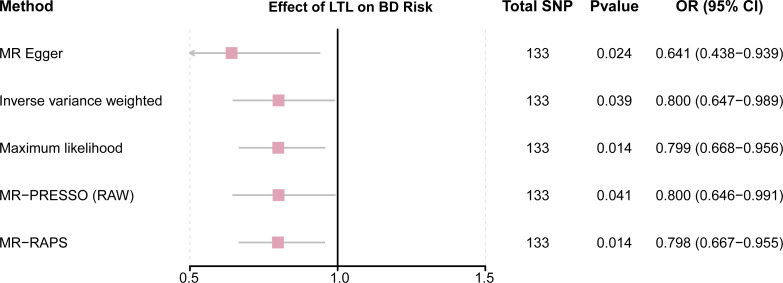
Figure 2. Forest plot to visualize causal effects of variation in LTL on BD.
Presented odds ratios (OR) and confidence intervals (CI) correspond to the effects of LTL on BD. The results of MR analyses using various analysis methods (MR–Egger, maximum likelihood, MR-PRESSO, MR–RAPS, IVW) are presented for comparison. Total single-nucleotide polymorphism (SNP) indicates the number of genetic variants used as instruments for MR analysis.

