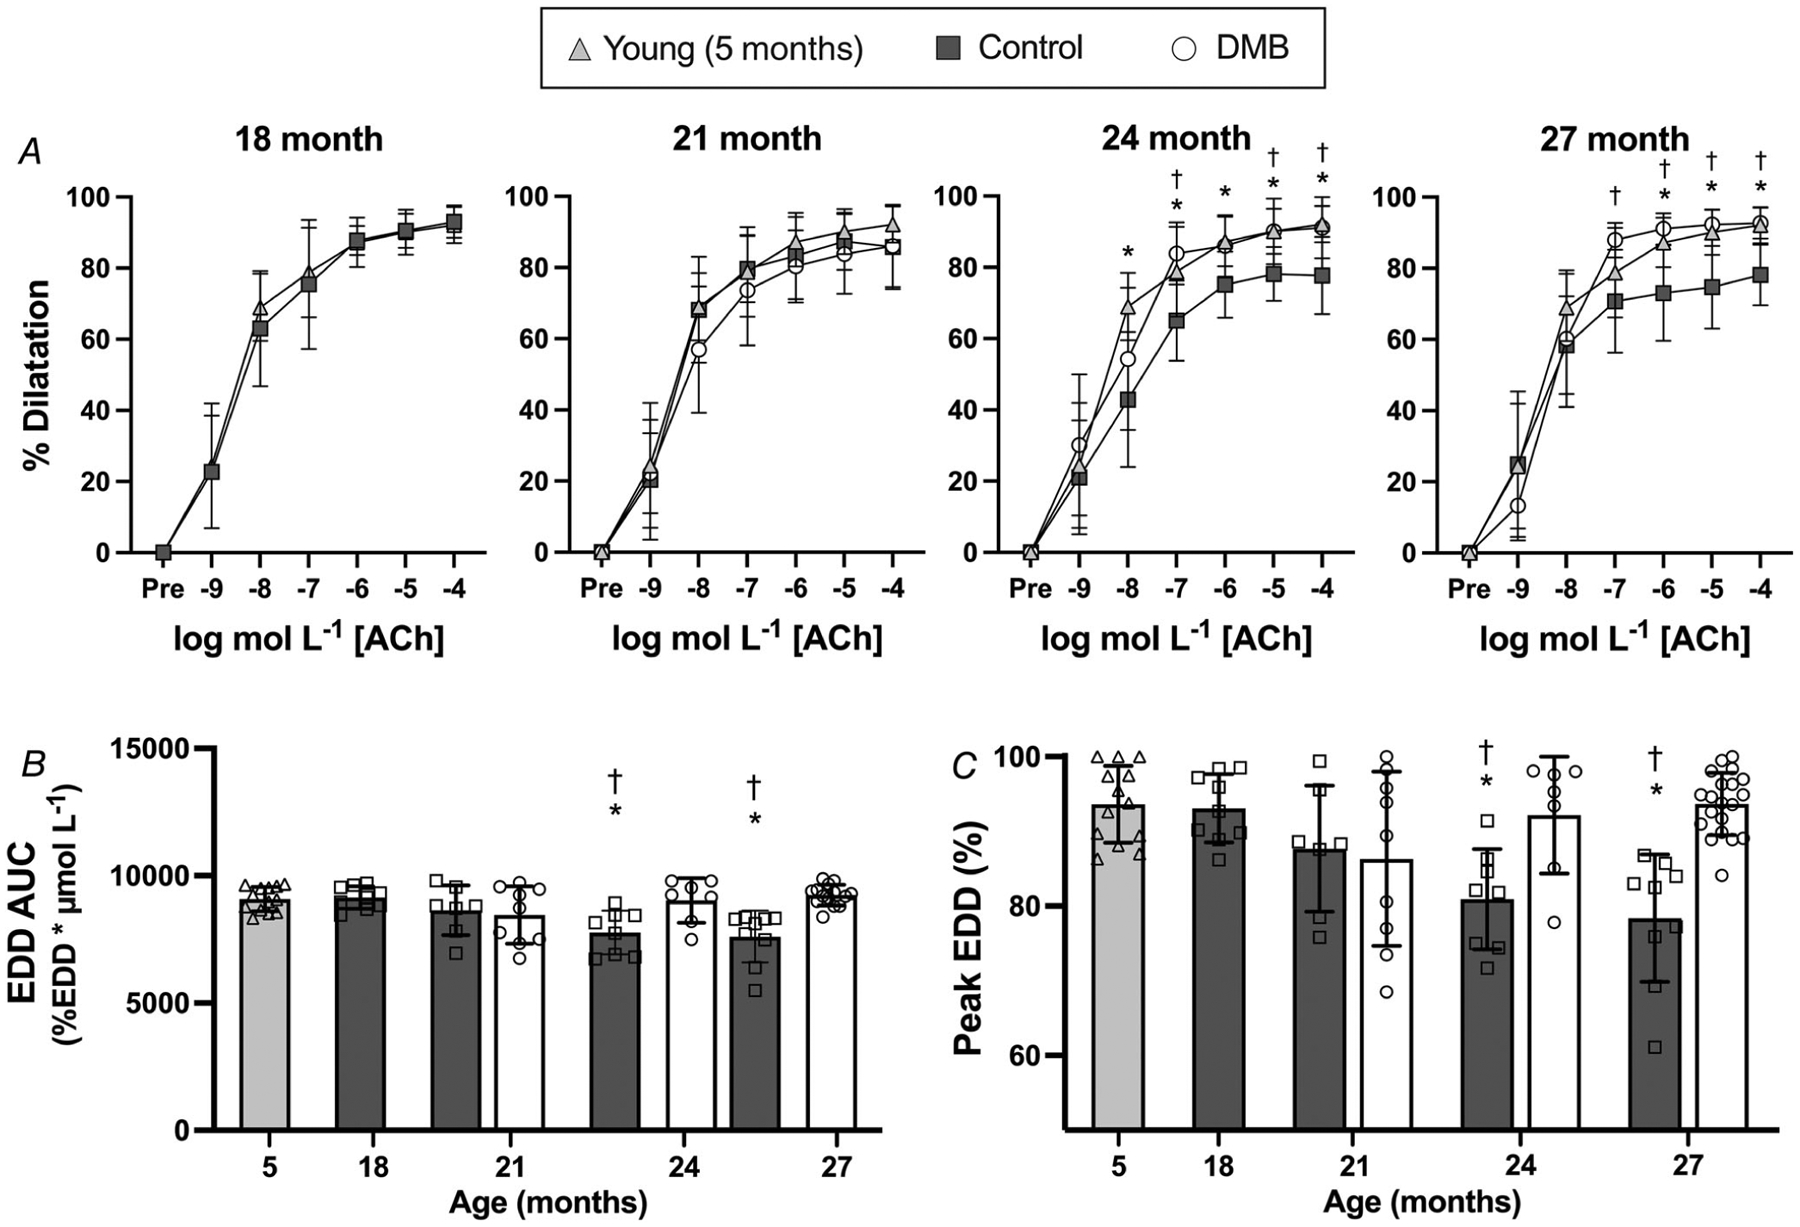
Figure 4. Supplementation with 3,3-dimethyl-1-butanol (DMB) prevents age-related impairments in endothelium-dependent dilatation (EDD).

A, carotid artery EDD in response to increasing doses of acetylcholine (ACh). B, EDD to ACh area under the curve (AUC). C, peak EDD to ACh. Data are mean SD. Statistics are two-way mixed (group × dose) ANOVA with Tukey’s post hoc test (A), or one-way (effect of age in control mice only) ANOVA with Dunnett’s post hoc test and two-way mixed (age × treatment group) ANOVA with Šídák’s post hoc test (B and C). *P < 0.05 control vs. young 5 month reference group, within dose. †P < 0.05 DMB vs. control, within dose. n = 7–14 per group.
