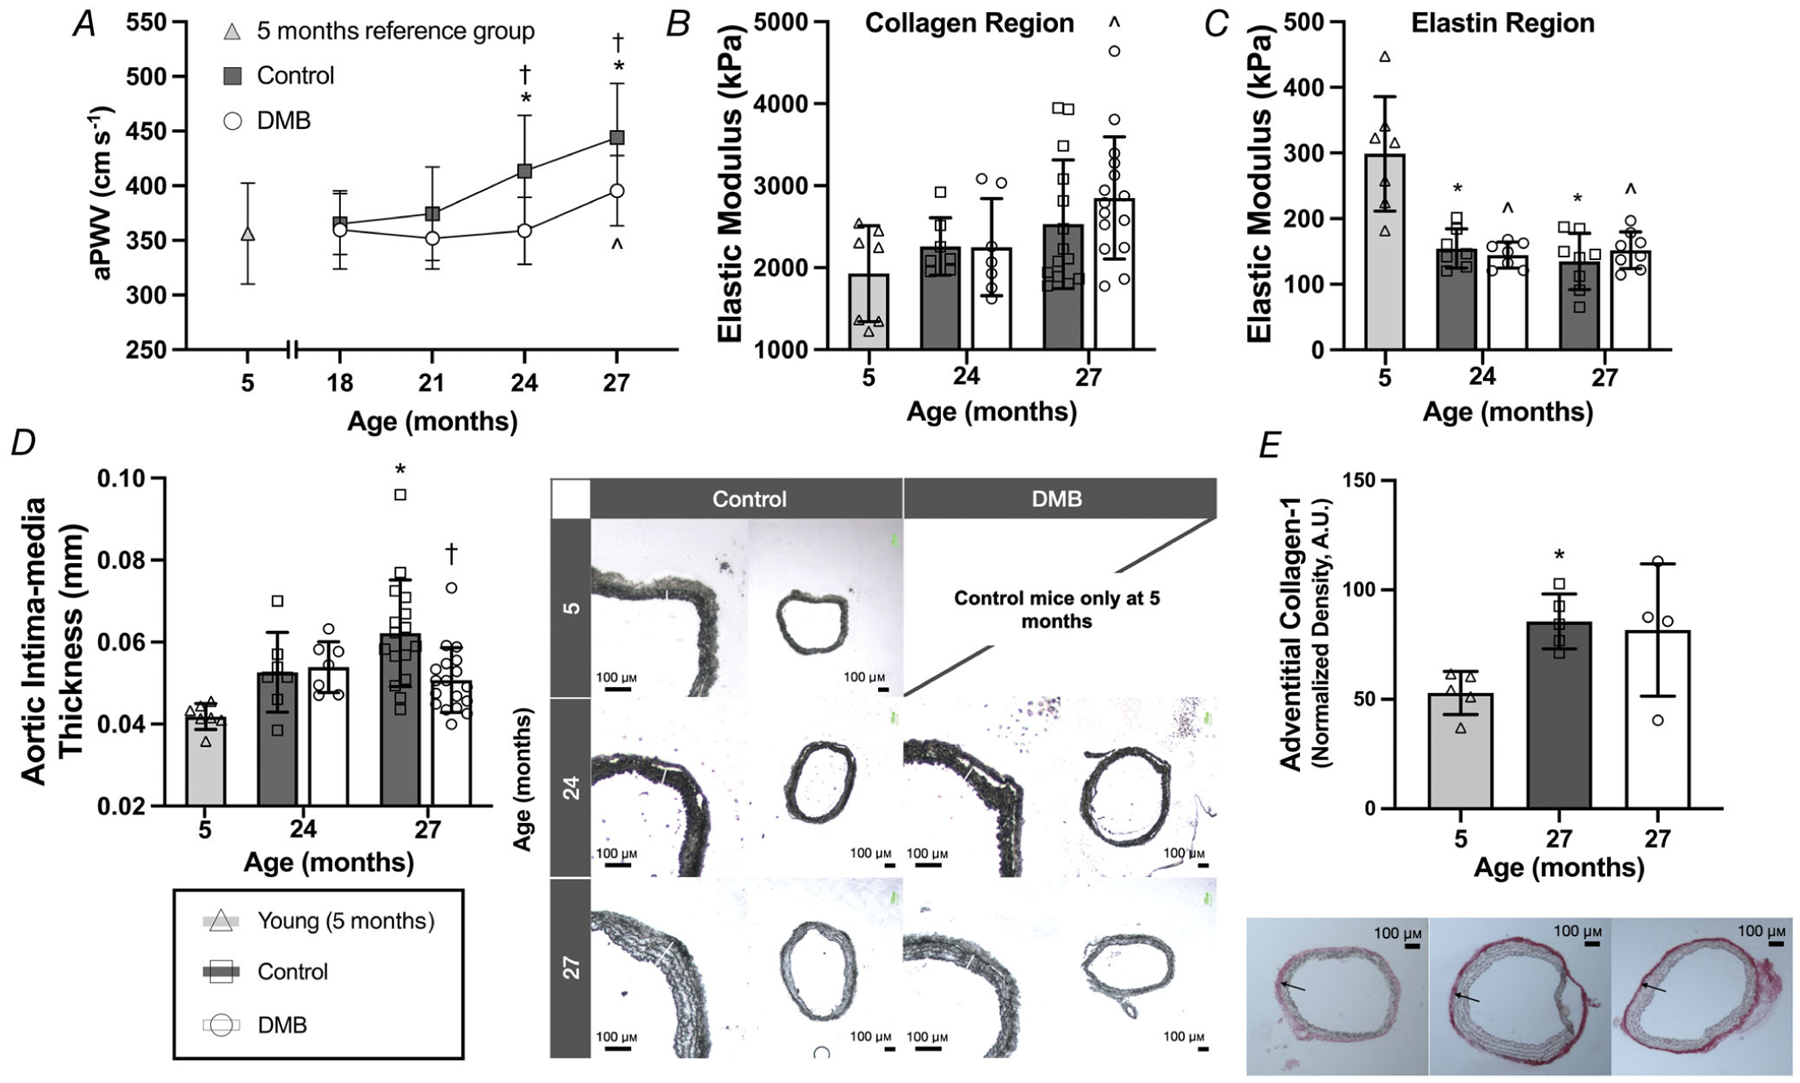
Figure 6. Supplementation with 3,3-dimethyl-1-butanol (DMB) delays and attenuates age-related increases in in vivo aortic stiffness and aortic intima-media thickness but does not alter aortic intrinsic mechanical stiffness nor adventitial collagen abundance.

A, in vivo aortic pulse wave velocity (aPWV). B and C, elastic modulus of the (B) collagen-dominant (high force) region of the stress–strain curve and (C) elastin-dominant (low force) region, conducted in 1–2 mm segments of thoracic aorta. D, intima-media thickness measured in 7 μm segments of thoracic aorta, with representative images shown to the right (4× magnification). E, abundance of type-1 collagen measured via quantitative immunohistochemistry in the adventitia of 7 μm segments of thoracic aorta, with representative images shown below (4 × magnification). Data are mean ± SD. Statistics are one-way (effect of age in control mice only) ANOVA with Dunnett’s post hoc test and/or two-way mixed (age × treatment group; A–D) ANOVA with Šídák’s post hoc test.*P < 0.05 control vs. young 5 month reference group. †P < 0.05 DMB vs. control within age group. ˆP < 0.05 DMB vs. young 5 month reference group. n = 7–21 per group.
