Figure 4.
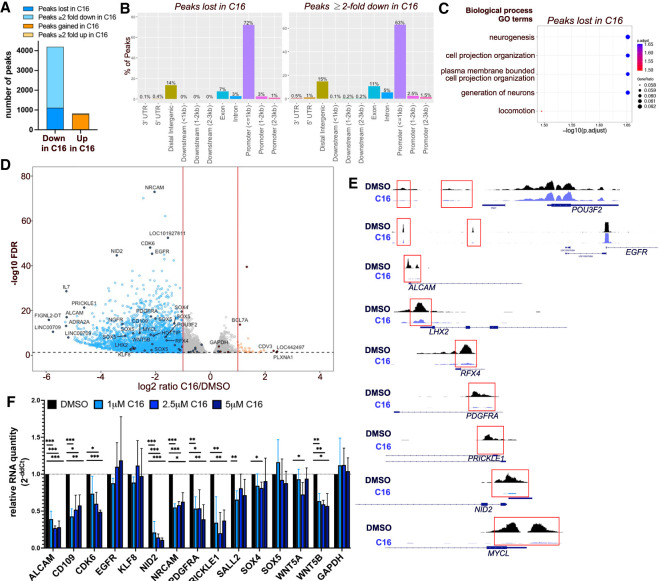
WDR5 inhibition leads to H3K4me3 loss at essential CSC genes. (A) Number of H3K4me3 CUT&Tag peaks lost, gained, decreased, or increased (log2FC ≤ −1 or log2FC ≥ 1) after C16 treatment (3 μM for 72 h) of DI318 cells. (B) Bar plot showing distribution of peaks in gene regions that were lost in the C16 group (unique to the DMSO group) or reduced twofold or greater in the C16 treatment group. (C) MSigDB gene set annotations enriched among CUT&Tag peaks lost in the C16 treatment group. (D) Volcano plot of differential H3K4me3 peaks detected by CUT&Tag in DI318 CSCs. Blue dots represent H3K4me3 peaks reduced twofold or greater (log2FC ≤ −1) with C16 treatment, and orange circles are H3K4me3 peaks increased twofold or greater (log2FC ≥ 1) with C16 treatment. Multiple peaks (circles) may map to the same gene. (E) Representative H3K4me3 peaks from CUT&Tag at the indicated genes (from Integrative Genomics Viewer). (F) qPCR for specified genes in DI318 CSCs treated with the indicated doses of C16 for 72 h. Bars represent mean expression of n = 3 biological replicates, normalized to ACTB levels by ddCt method, ±SD.

