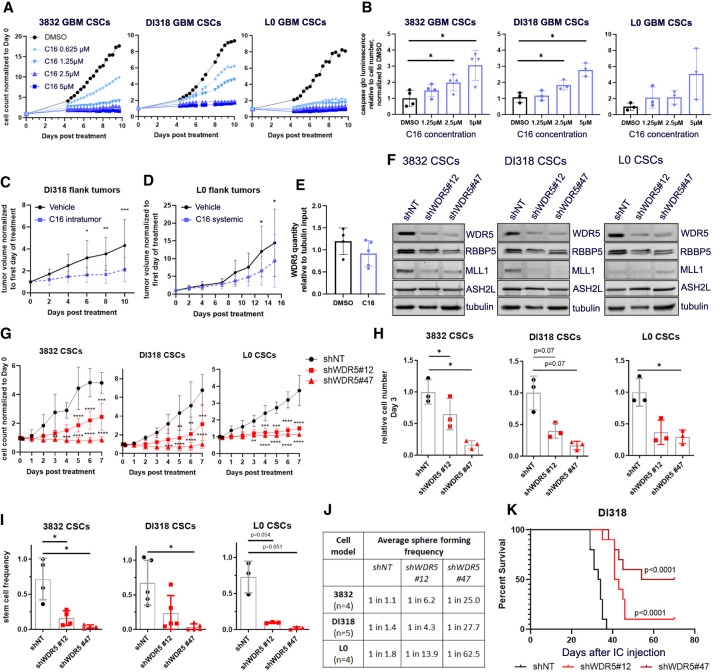
Figure 7.
Pharmacologic and genetic inhibition of WDR5 reduces GBM CSC growth, self-renewal, and in vivo tumor growth. (A) Proliferation of WDR5 inhibitor C16-treated CSCs over 10 d, measured by IncuCyte live-cell imaging. Values represent mean fold change in cell count relative to day 0, ±SD; n = 3 technical replicates; one representative experiment is shown per CSC model. (B) GBM CSCs were treated with a range of concentrations of C16 and subjected to caspase 3/7 Glo luminescence assay after 4 d to measure caspase 3/7 activity. Bars represent fold change in caspase 3/7 activity per cell relative to the average for DMSO-treated cells, ±SD; circles are biological replicates. P-values were determined by one-way ANOVA and post-hoc Dunnett's multiple comparisons test. (C) Five-hundred-thousand DI318 CSCs were implanted into the flanks of mice, and once tumors developed, 3 mg/kg C16 was injected into the tumors daily. n = 10 per group. (D) Five-hundred-thousand L0 CSCs were implanted into the flanks of mice, and once tumors developed, 10 mg/kg C16 was injected intraperitoneally daily. n = 9 (DMSO); n = 10 (C16). For C and D, tumor volume over time normalized to tumor size at day 0 is shown. P-values were determined by two-tailed, unpaired t-test comparing means per group at each time point. (E) Immunoprecipitation of RBBP5 and immunoblot for WDR5 were performed on flank tumor lysates isolated from treated mice in D. Symbols are individual mice. WDR5 quantity in RBBP5 pull-down relative to tubulin quantity in input (10%) is plotted. (F) Short hairpin RNA-mediated targeting of WDR5 with two nonoverlapping short hairpins in CSC models. Western blots show the level of WDR5 protein in CSCs infected with a nontargeting (shNT) control virus or WDR5 knockdown (KD) viruses. (G) Proliferation of WDR5 KD and shNT control CSCs over 7 d, determined by IncuCyte live-cell imaging. Values represent mean fold change in cell count relative to day 0, ±SD; n = 3 biological replicates, P-values were determined by two-tailed, unpaired t-tests comparing means per group at each time point. (H) Equal numbers of WDR5 KD and shNT control CSCs were plated, and viable cell counts were measured by CellTiter Glo luminescence viability assay after 72 h. Bars represent mean luminescence values relative to the average for shNT control cells, ±SD; circles are biological replicates, (I) In vitro limiting dilution analysis was performed on WDR5 KD and shNT control CSCs. Bars represent mean sphere formation frequency, ±SD; symbols are biological replicates. For H and I, P-values were determined by one-way ANOVA and post-hoc Dunnett's multiple comparisons test. (J) Related to I, mean sphere formation frequency for each group is shown. (K) Kaplan–Meier survival plot of mice intracranially implanted with WDR5 KD or shNT control CSCs. P-values indicate comparisons between shNT and shWDR5 and were determined by log rank analysis. n = 10 per group; median survival shNT: 33.5 d; shWDR5 #12: 42 d; shWDR5 #47: 62 d.

