Figure 5.
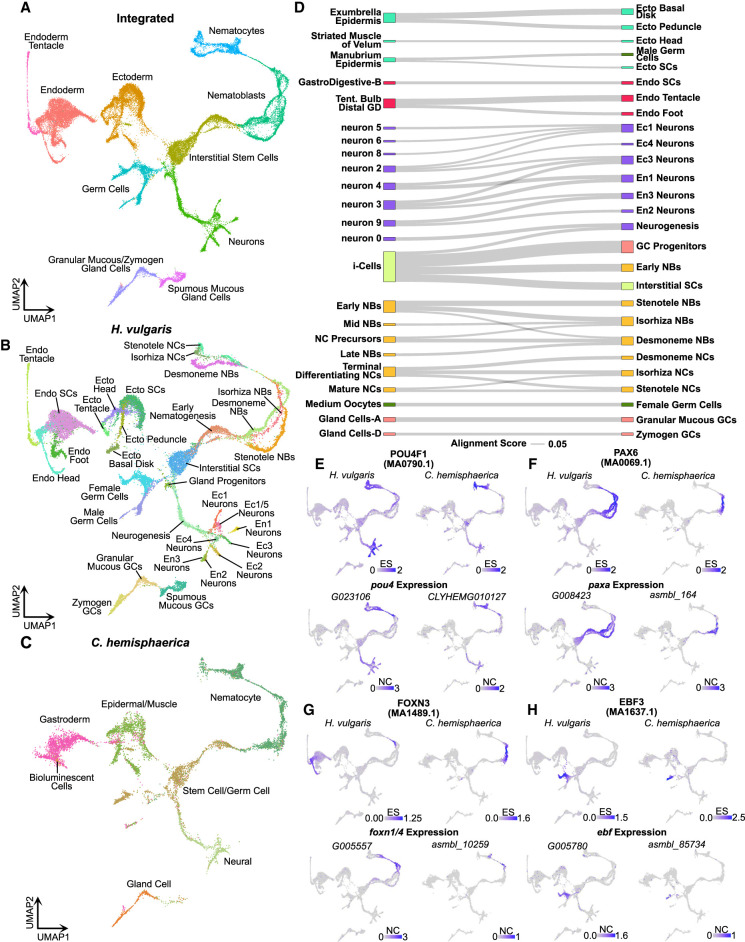
Aligned Hydra and Clytia single-cell atlases reveal conserved cell type–specific transcriptional regulation. (A–C) UMAP dimensional reduction of aligned Hydra and Clytia medusa single-cell atlases clusters together equivalent cell types from the two species. (D) Sankey plot showing transcriptional similarities between Hydra (right column) and Clytia (left column) cell types highlights extensive similarities among interstitial cell types. The alignment score quantifies the proportion of mutual nearest neighbors for one cell type that are made up of members of another cell type. An alignment score threshold of 0.05 was used to exclude poorly aligned cell types. (NCs) Nematocytes; (NBs) nematoblasts; (SCs) stem cells; (Ecto) ectodermal epithelial cells; (Endo) endodermal epithelial cells; (GCs) gland cells; (Ec) neuron subtypes found in the ectoderm; (En) neuron subtypes found in the endoderm; (Tent.) tentacles; (GD) gastroderm. (E–H) Conserved motif enrichment and gene expression patterns reflect gene regulatory network conservation in hydrozoans. (E) pou4 is a conserved regulator of late stage and mature neurons and nematocytes. (F) paxA is a conserved regulator of nematoblasts. (G) foxn1/4 is a conserved regulator of nematocyte maturation. (H) ebf is a conserved regulator of oogenesis. (ES) Enrichment score; (NC) normalized counts.

