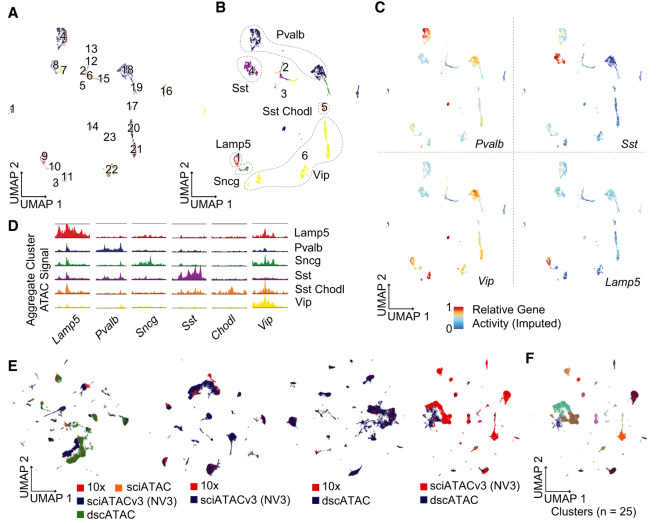
Figure 5.
sciATACv3 integration and interneuron subtyping. (A) UMAP of GABAergic neurons colored by cluster and by (B) subtype. (C) Imputed gene activity scores for subtype-defining marker genes, and (D) marker gene accessibility tracks. (E) Integration with other mouse brain single-cell ATAC-seq data sets as well as paired data set integrations. (F) Called clusters on the integrated dscATAC and nanowell sciATACv3 data sets. Despite poor visualization, only 2.3% of cells are in method-specific clusters.

