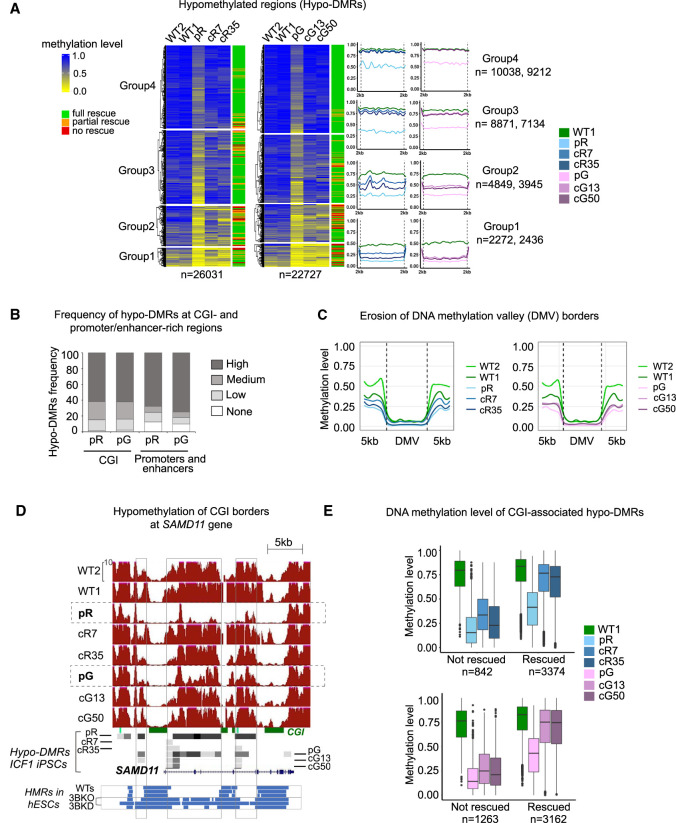
Figure 1.
Hypo-DMRs in ICF1 iPSCs are largely corrected following the restoration of DNMT3B gene activity. (A) Heatmap representation of methylation levels as determined by WGBS (expressed as ratio of the number of Cs over the total number of Cs and Ts) at hypo-DMRs in pR and pG ICF1 iPSCs, their respective corrected clones, and controls WT1 and WT2. The hypo-DMRs were clustered using k-means into four groups based on the methylation level across ICF1 iPSCs. The last column on the right indicates the ICF1 hypo-DMR rescue status: full, partial, and no rescue of ICF1 hypo-DMRs indicate remethylation in both, single, or none of the corrected clones. The profile plots on the right depict the average methylation level of each subgroup of hypo-DMRs and their flanking regions (±2 kb). The numbers of hypo-DMRs in pR and pG iPSCs in each group are indicated on the right. (B) Stacked bar plot representing the proportion of ICF1 hypo-DMRs that are present in genomic regions (1 Mb) categorized based on the number of CGI or promoters/enhancers as high (>10), medium (5–10), low (1–4), or none. (C) Plots of average weighted CG methylation levels across DNA methylation valleys (DMVs) and flanking 5 kb regions in ICF1 and corrected iPSCs clones in comparison to the WT1 and WT2 iPSCs. The 0 to 1 scale at the y-axis denotes the CG methylation level measured in each bin. (D) A genome browser view of CGIs in the SAMD11 gene, representing an example of methylation loss at CGI edges in ICF1 iPSCs compared to WT counterparts. Red tracks denote methylation coverage measured by WGBS in all iPSCs. Gray boxes represent hypo-DMRs detected in patients and corrected iPSCs compared to controls. Four shades of gray from light gray to black indicate differential methylation scores compared to WT1 as follows: −25 to −39, −40 to −59, −60 to −79, and −80 to −100, respectively. The blue tracks at the bottom illustrate the hypomethylated regions (HMRs) in WT human embryonic stem cells (hESCs) from H1, HUES9, and H9 lines, followed by DNMT3B-KO hESCs (early and late passage DNMT3B-KO; 3BKO) and shRNA DNMT3B-KD hESCs (3BKD). (E) Boxplots representing the distribution of methylation levels at CGI-associated hypo-DMRs in ICF1 iPSCs which remain hypomethylated (not rescued) and those that are rescued in the corresponding isogenic clones.

