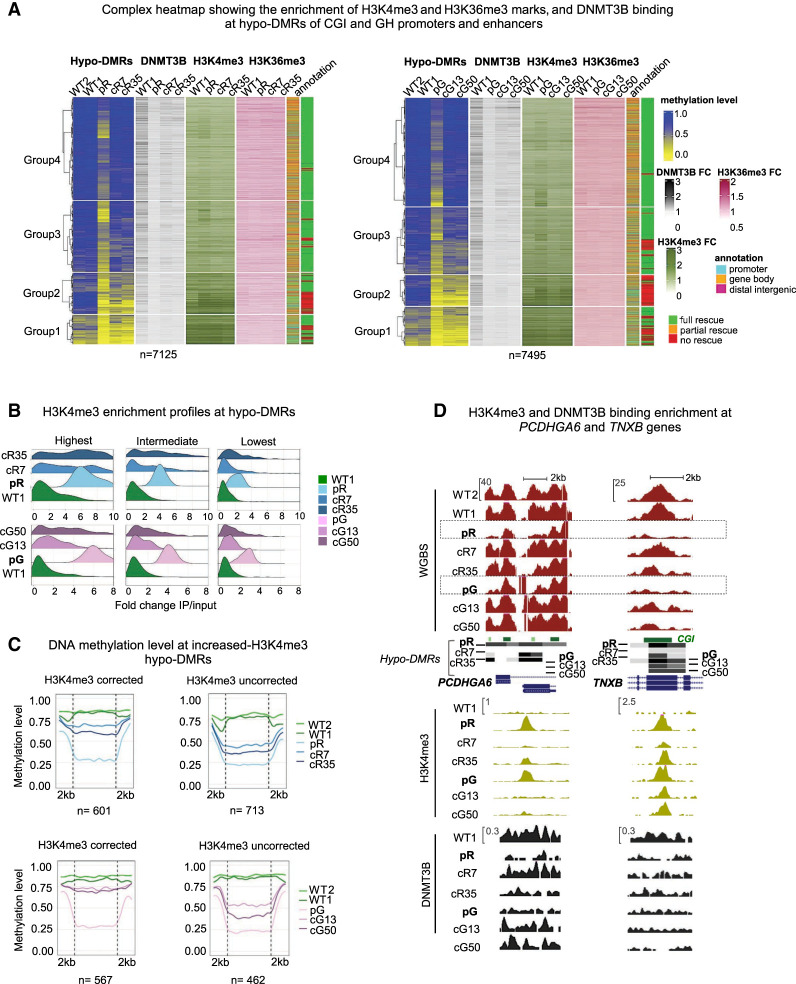
Figure 4.
Hypo-DMRs persist at regions with the highest aberrant increase of H3K4me3. (A) A complex heatmap showing the integration of ChIP-seq data of DNMT3B binding, and H3K4me3 and H3K36me3 marks with methylation levels of hypo-DMRs at CGI and GH elements. The gene annotation of the hypo-DMRs and their status of correction are depicted on the right. The hypo-DMRs are divided into four clusters based on Groups 1–4 derived from Figure 1A. FC = Fold change (IP/input) of the ChIP-seq enrichment calculated at the hypo-DMRs. (B) Ridgeline plots depicting the distribution of the fold change (FC) of H3K4me3 enrichment at increased H3K4me3 differentially enriched regions (DERs) proximal to ICF1 hypo-DMRs. The increased H3K4me3 DERs in pR and pG were divided into three groups based on the FC ranking levels in ICF1 iPSCs, and the FC was calculated for the respective corrected clones at the DERs. (C) Plots of average CG methylation levels across hypo-DMRs associated with increased H3K4me3 DERs in ICF1 iPSCs. The left panels include DERs in which the H3K4me3 levels are restored to normal levels in both corrected clones of pR (top) and pG (bottom), whereas the right panels include increased H3K4me3 DERs which persist in corrected clones of pR and pG. (D) Genome browser views of representative regions characterized by abnormal increase of H3K4me3 levels at hypo-DMRs in ICF1 iPSCs. The H3K4me3 levels are fully or partially reverted in corrected clones together with hypomethylation at the PCDHGA6 gene, whereas high H3K4me3 levels persist at the TNXB gene. Green and black tracks represent H3K4me3 and DNMT3B binding enrichment levels.

