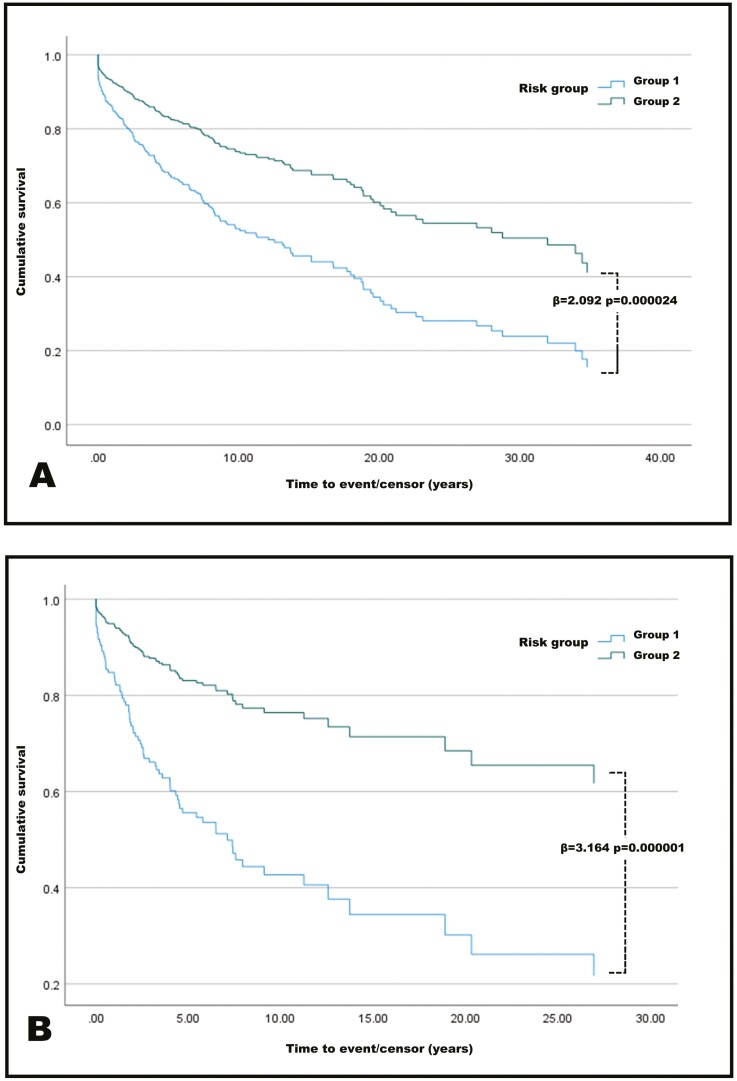
Figure 2.
A, Cox proportional hazard survival plot for all patients. Patients are divided into high risk of stricturing (group 1) and low risk of stricturing (group 2). High risk compared with low risk, hazard ratio of 2.092. B, Restriction of survival analysis to patients diagnosed younger than 18 years of age. High risk compared with low risk, hazard ratio of 3.164.

