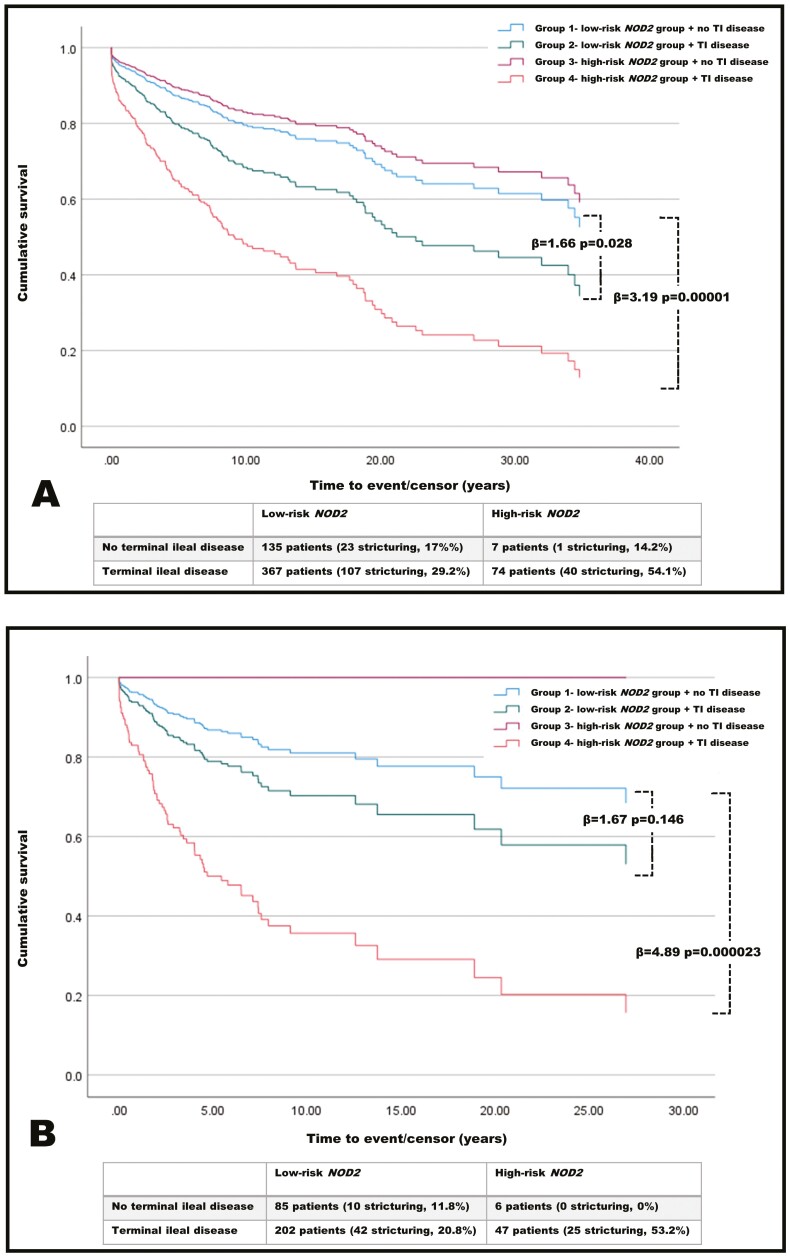
Figure 3.
A, Cox proportional hazard survival plot for all patients. Patients are divided into 4 groups. When comparing the lowest risk patients in group 1 to both group 2 and group 4, there are significant increases in the risk of developing stricturing disease. B, Restriction of survival analysis to patients diagnosed younger than 18 years of age. The highest risk of stricturing disease occurred in group 4, with a hazard ratio of 4.89 (P = .000023) compared with group 1.

