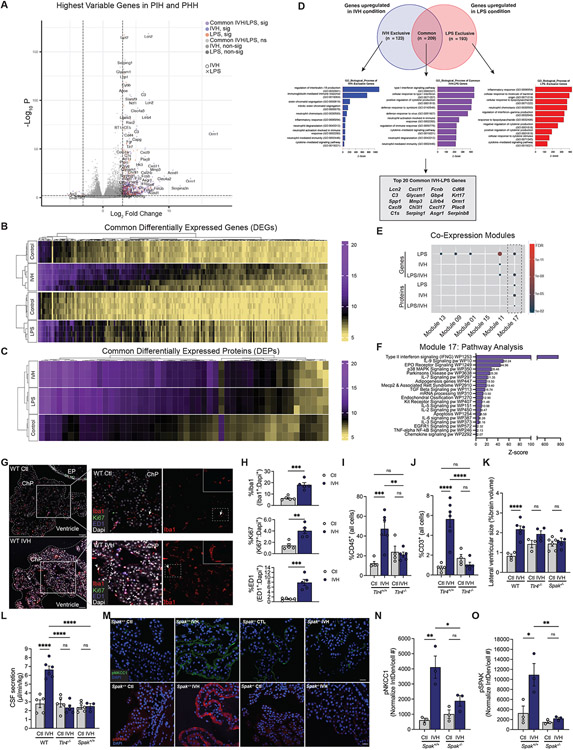
Figure 4. Post-hemorrhagic and -infectious hydrocephalus models exhibit highly similar ChP immune-secretory pathophysiology.
(A) Volcano plot and heatmaps of the most highly significant (sig) (B) DEGs and (C) DEPs compared to control from bulk RNAseq analyses of ChP from Ctl, IVH, and LPS-treated animals (n=3-5 animals per condition). (D) Venn diagram and GO biological process analysis of genes upregulated in IVH versus LPS conditions, and those common to both conditions. Outlined box at the bottom shows the top 20 DEGs common to IVH and LPS. (E) Hypergeometric enrichment analysis of gene co-expression modules for DEG/DEPs between LPS and IVH, and shared (LPS/IVH) DEG/DEPs (dashed box highlights shared enrichment in Module 17). (F) Module 17 pathway analysis. (G) Representative IHC of Iba1 (red), Ki67 (green), and ED1 (blue) cells in ChP of Ctl and IVH-treated rats (n=5 animals per condition) (ChP border denoted by dashed white outline; EP, ependyma). Left panel inset, ChP magnification; right panel inset, magnification Iba1+ cell (white arrows). Scale bars, 50μm. (H) Quantitative IHC in (G) showing % (normalized to DAPI) of ED1+, Ki67+, and Iba1+ cells (n=5 animals per condition). (I, J) FACS quantification of (I) CD45+ and (J) CD3+ cells in ChP from IVH-treated Tlr4+/+ and Tlr4−/− rats (n=4-6 animals per condition). (K) Quantitation of lateral ventricular size (% brain volume) and (L) body weight-normalized CSF secretion in WT, Tlr4−/−, and Spak−/− IVH-treated (48h) rats (n=3-6 animals per condition). (M) Representative ChP IHC of pNKCC1 (green) and pSPAK (red) expression in Ctl and IVH-treated Spak+/+ and Spak−/− animals. Scale bars, 25 μm. Quantitation of (N) pNKCC1 (Interval Density/cell #) and (R) pSPAK IHC in (O) (n=6 ChP, 3 animals per condition). Error bars, mean ±sem; each symbol represents one animal. *p<0.05, **p<0.01, ***p<0.001, ****p<0.0001, ns = not significant; unpaired t-test (K) or one-way ANOVA (L-O, Q, R). [D-G, abbreviations: pos reg = positive regulation, neg reg = negative regulation, pw = pathway, act = activity, a/o = acting on, FA = focal adhesion, Mϕ = macrophage].

