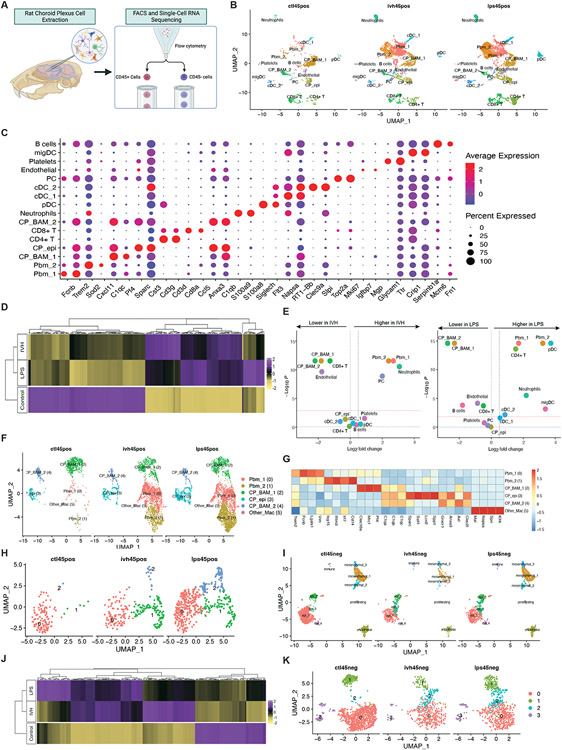
Figure 5. scRNAseq uncovers crosstalk between peripheral and resident immune cells and epithelial cells at the ChP.
(A) Schematic illustrating the scRNA experimental design and downstream analyses. (B) UMAP clustering of ChP CD45+ cells across control, IVH-treated and LPS-treated conditions, colored by cell type. (C) DotPlot showing gene expression signatures of CD45+ cell clusters, with dot size representing the percentage of cells expressing the gene and the color representing average expression within a cluster. (D) Heatmap of the top differentially expressed genes (DEGs) comparing ChP CD45+ cell expression profiles from Ctl, IVH, and LPS-treated animals. (E) Volcano plots depicting differences of cluster abundance in IVH-treated and LPS-treated ChP CD45+ cells compared to control plotting fold change (log10) against p-value (−log10) based on beta-binomial regression. The red horizontal dashed line indicates the significance threshold. (F) UMAP of ChP myeloid cell clusters, including peripheral blood macrophages, CP stromal macrophages and CP epiplexus macrophages, colored by cell type. (G) Heatmap of the top DEGs for myeloid subclusters. (H) UMAP of ChP epiplexus macrophage subclusters, colored by group, showing transformed and proliferating epiplexus macrophages in control, IVH, and LPS conditions. (I) UMAP clustering of ChP CD45− cells across IVH-treated, LPS-treated, and control conditions, colored by cell type. (J) Heatmap of top DEGs comparing ChP CD45− epithelial cell expression profiles from Ctl, IVH, and LPS-treated animals. (K) UMAP of ChP epithelial subclusters, colored by group.

