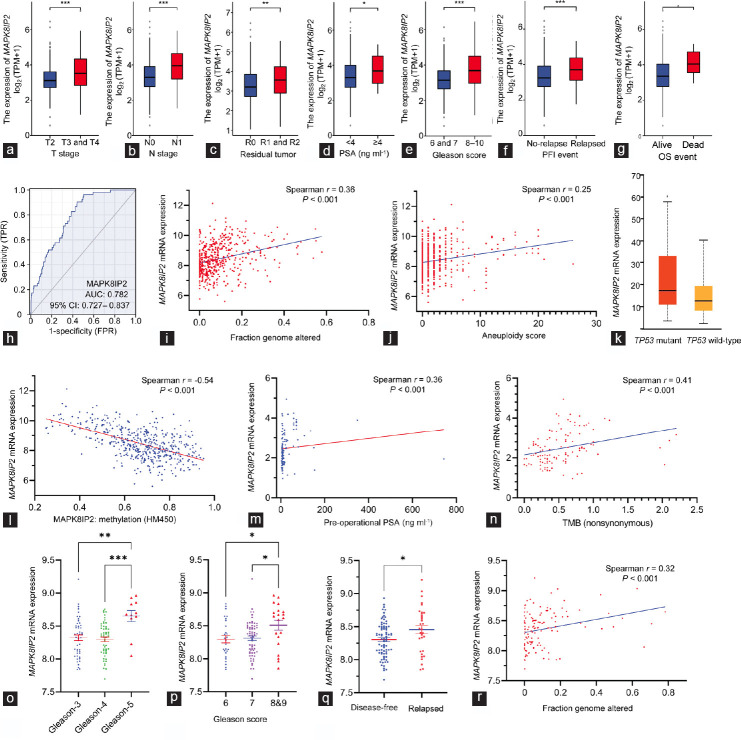
Figure 2.
MAKP8IP2 expression was increased along with prostate cancer progression. (a–g) MAPK8IP2 expression levels in the TCGA-PRAG dataset were compared in different groups of clinicopathological parameters, including (a) TNM stages, (b) lymph node invasion, (c) postsurgery residual tumors, (d) presurgery serum PSA levels, (e) Gleason score, (f) progression-free incidence, and (g) overall survival. Case numbers in each subgroup are listed as follows: n = 189 for T2; n = 292 for T3; n = 11 for T4; n = 347 for N0; n = 79 for N1; n = 315 for R0; n = 148 for R1; n = 5 for R2; n = 415 for PSA <4 ng ml−1; n = 27 for PSA ≥4 ng ml−1; n = 46 for Gleason-6; n = 247 for Gleason-7; n = 64 for Gleason-8; n = 138 for Gleason-9; n = 4 for Gleason-10; n = 405 for progression-free; n = 94 for relapsed; n = 489 for alive; and n = 10 for dead. The asterisks indicate a significant difference by Wilcoxon rank-sum test. *P < 0.05; **P < 0.01; ***P < 0.001. (h) ROC analysis for the predictive potential of MAPK8IP2 upregulation in prostate cancers. (i and j) Spearman’s coefficient analysis between MAPK8IP2 expression and tumor genetic abnormalities, (i) FGA and (j) aneuploidy scores, was conducted with the RNA-seq TCGA PanCancer Atlas dataset (n = 494) downloaded from the cBioportal platform. (k) Comparison of MAPK8IP2 expression in prostate cancer with wild-type (n = 295) or mutant (n = 38) TP53 gene was conducted on the UALCAC platform. The asterisk indicates a significant difference (Student’s t-test, *P < 0.05). (l) MAPK8IP2 expression is inversely correlated with DNA methylation in prostate cancer. Spearman’s coefficient analysis was conducted using the RNA-seq dataset generated from the TCGA Firehose Legacy dataset (n = 498) downloaded from the cBioportal platform. DNA methylation data were generated using the Human Methylation-450 Bead chip. (m and n) Spearman’s coefficient analysis was performed using the DKFZ RNA-seq dataset,27 which consisted of 116 early-onset prostate cancer patients for (m) preoperation PSA analysis and (n) tumor mutation burden score. (o–r) MAPK8IP2 expression was assessed using the MSKCC RNA-seq dataset28 for the differences among different (o) Gleason primary scores, (p) Gleason sum scores, (q) disease relapses, and (r) genomic alterations. The asterisks indicate a significant difference by (o) ANOVA test, (p) Kruskal-Wallis test and (q) Student’s t-test. *P < 0.05; **P < 0.01; ***P < 0.001. Case numbers in each subgroup is listed as follow: n = 47 for Gleason-3; n = 52 for Gleason-4; n = 11 for Gleason-5; n = 27 for Gleason-6; n = 64 for Gleason-7; n = 20 for Gleason-8 and -9; n = 80 for disease-free; and n = 32 for relapsed. AUC: area under the curve; TMB: tumor mutation burden; MAPK: mitogen-activated protein kinase; MAPK8IP2: MAPK8-interacting protein 2; TCGA-PRAD: The Cancer Genome Atlas–Prostate Adenocarcinoma; TNM: tumor, nodal, and metastasis; PSA: prostate-specific antigen; ROC: receiver operating characteristic; FGA: fraction genome altered; OS: overall survival; ANOVA: analysis of variance; TP53: tumor protein p53; CI: confidence interval.

