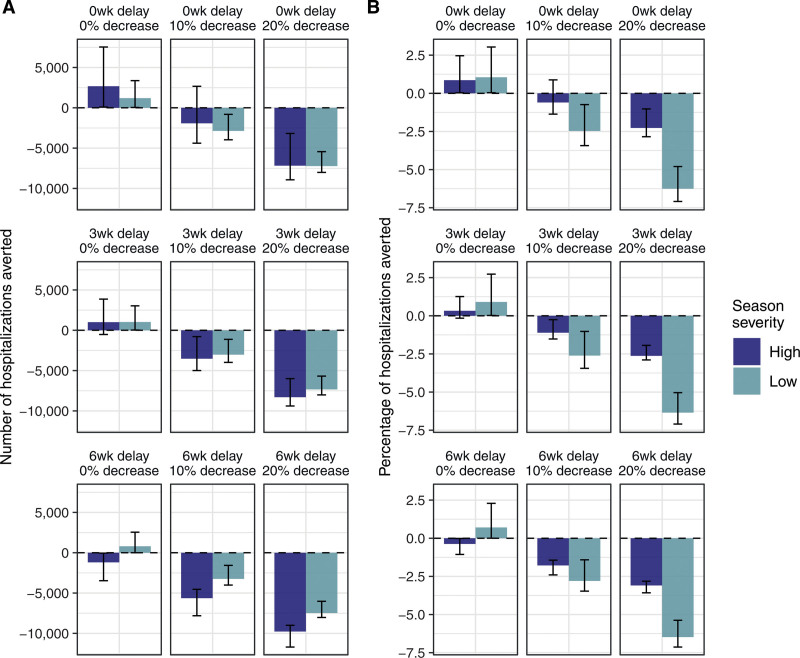
FIGURE 1.
Averted hospitalizations in adults ≥65 under different trade-off scenarios. Bars indicate the mean number (A) and percentage relative to baseline (B) of averted hospitalizations from 1,000 uniform Latin hypercube parameter combinations; error bars are the 95th percentiles. Each panel shows a different combination of the delay in administration of additional higher-dose or adjuvanted vaccines (0, 3, or 6 weeks), and reduction in overall vaccine coverage (0, 10, or 20 percentage points). Positive values indicate a decrease in burden relative to the corresponding baseline simulation and therefore a positive impact of the new recommendation. Results for the number of averted symptomatic cases and deaths are shown in eFigure 8, http://links.lww.com/EDE/C18, and results assuming a logit-normal distribution for rVE with a median value of 15% are shown in eFigure 12, http://links.lww.com/EDE/C18. rVE indicates relative vaccine effectiveness.

