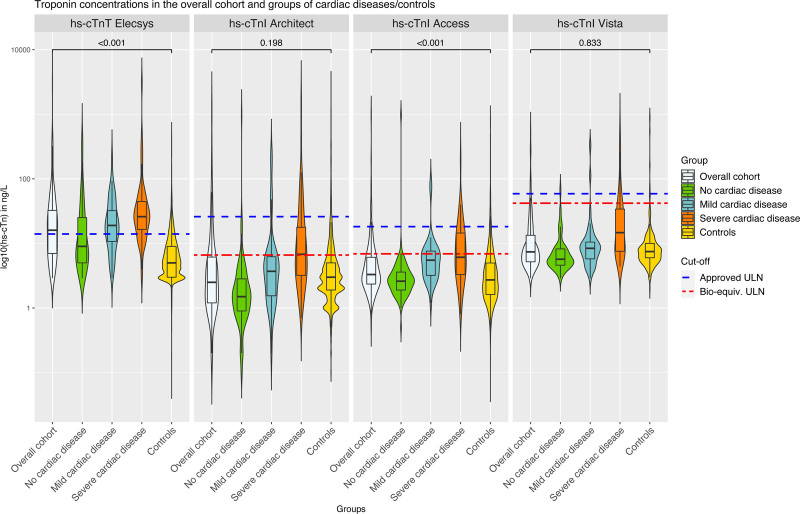
Figure 1.
Violine plots representing the distribution of hs-cTnT/I concentrations for the 4 tested assays and across categories of cardiac disease. A single comparison using a Mann-Whitney U test was conducted between the control subjects of the APACE (Advantageous Predictors of Acute Coronary Syndromes Evaluation) cohort and the overall cohort of patients with skeletal muscle disorder. Bioequivalent and overall approved upper limits of normal (ULNs) are represented as broken lines. High-sensitivity cardiac troponin T (hs-cTnT)–Elecsys and high-sensitivity cardiac troponin I (hs-cTnI)–Architect concentrations were available in all 211 patients; hs-cTnI–Access concentrations, in 187 patients; and hs-cTnI–Vista concentrations, in 194 patients. The P values were calculating with a Wilcoxon test comparing the overall group with the control group and have been corrected for multiple testing (4 tests) with the Benjamini and Hochberg method.

