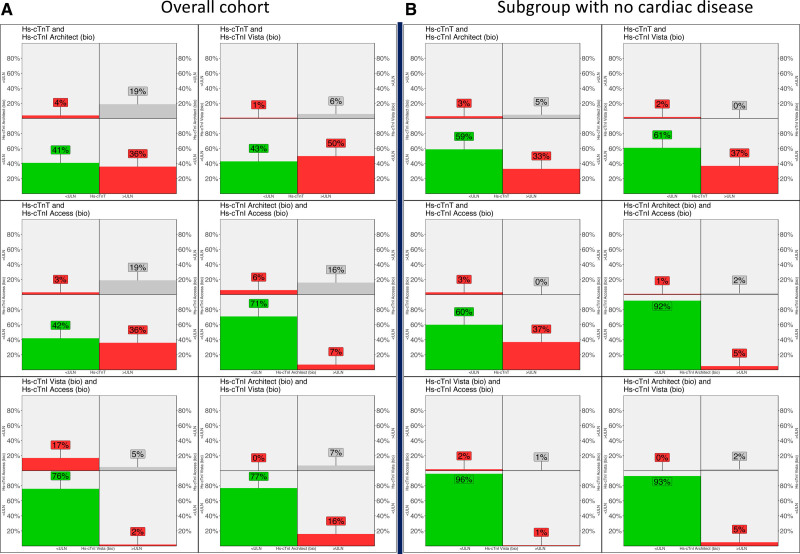
Figure 2.
Interassay hs-cTnT/I mismatches using biologically equivalent ULN. For each subpanel, 2 high-sensitivity cardiac troponin T/I (hs-cTnT/I) assays are represented with their biologically equivalent assay-specific 99th percentile upper limit of normal (ULN). In each panel, the 4 quadrants represent the percentage of patients with the following constellations: green when both hs-cTnT/I assays were below the ULN, gray when both were above the ULN, and red when there was an hs-cTnT/I mismatch (with 1 of the assays above and 1 of the assays below the ULN). A, Overall cohort. B, Subgroup without cardiac disease.

