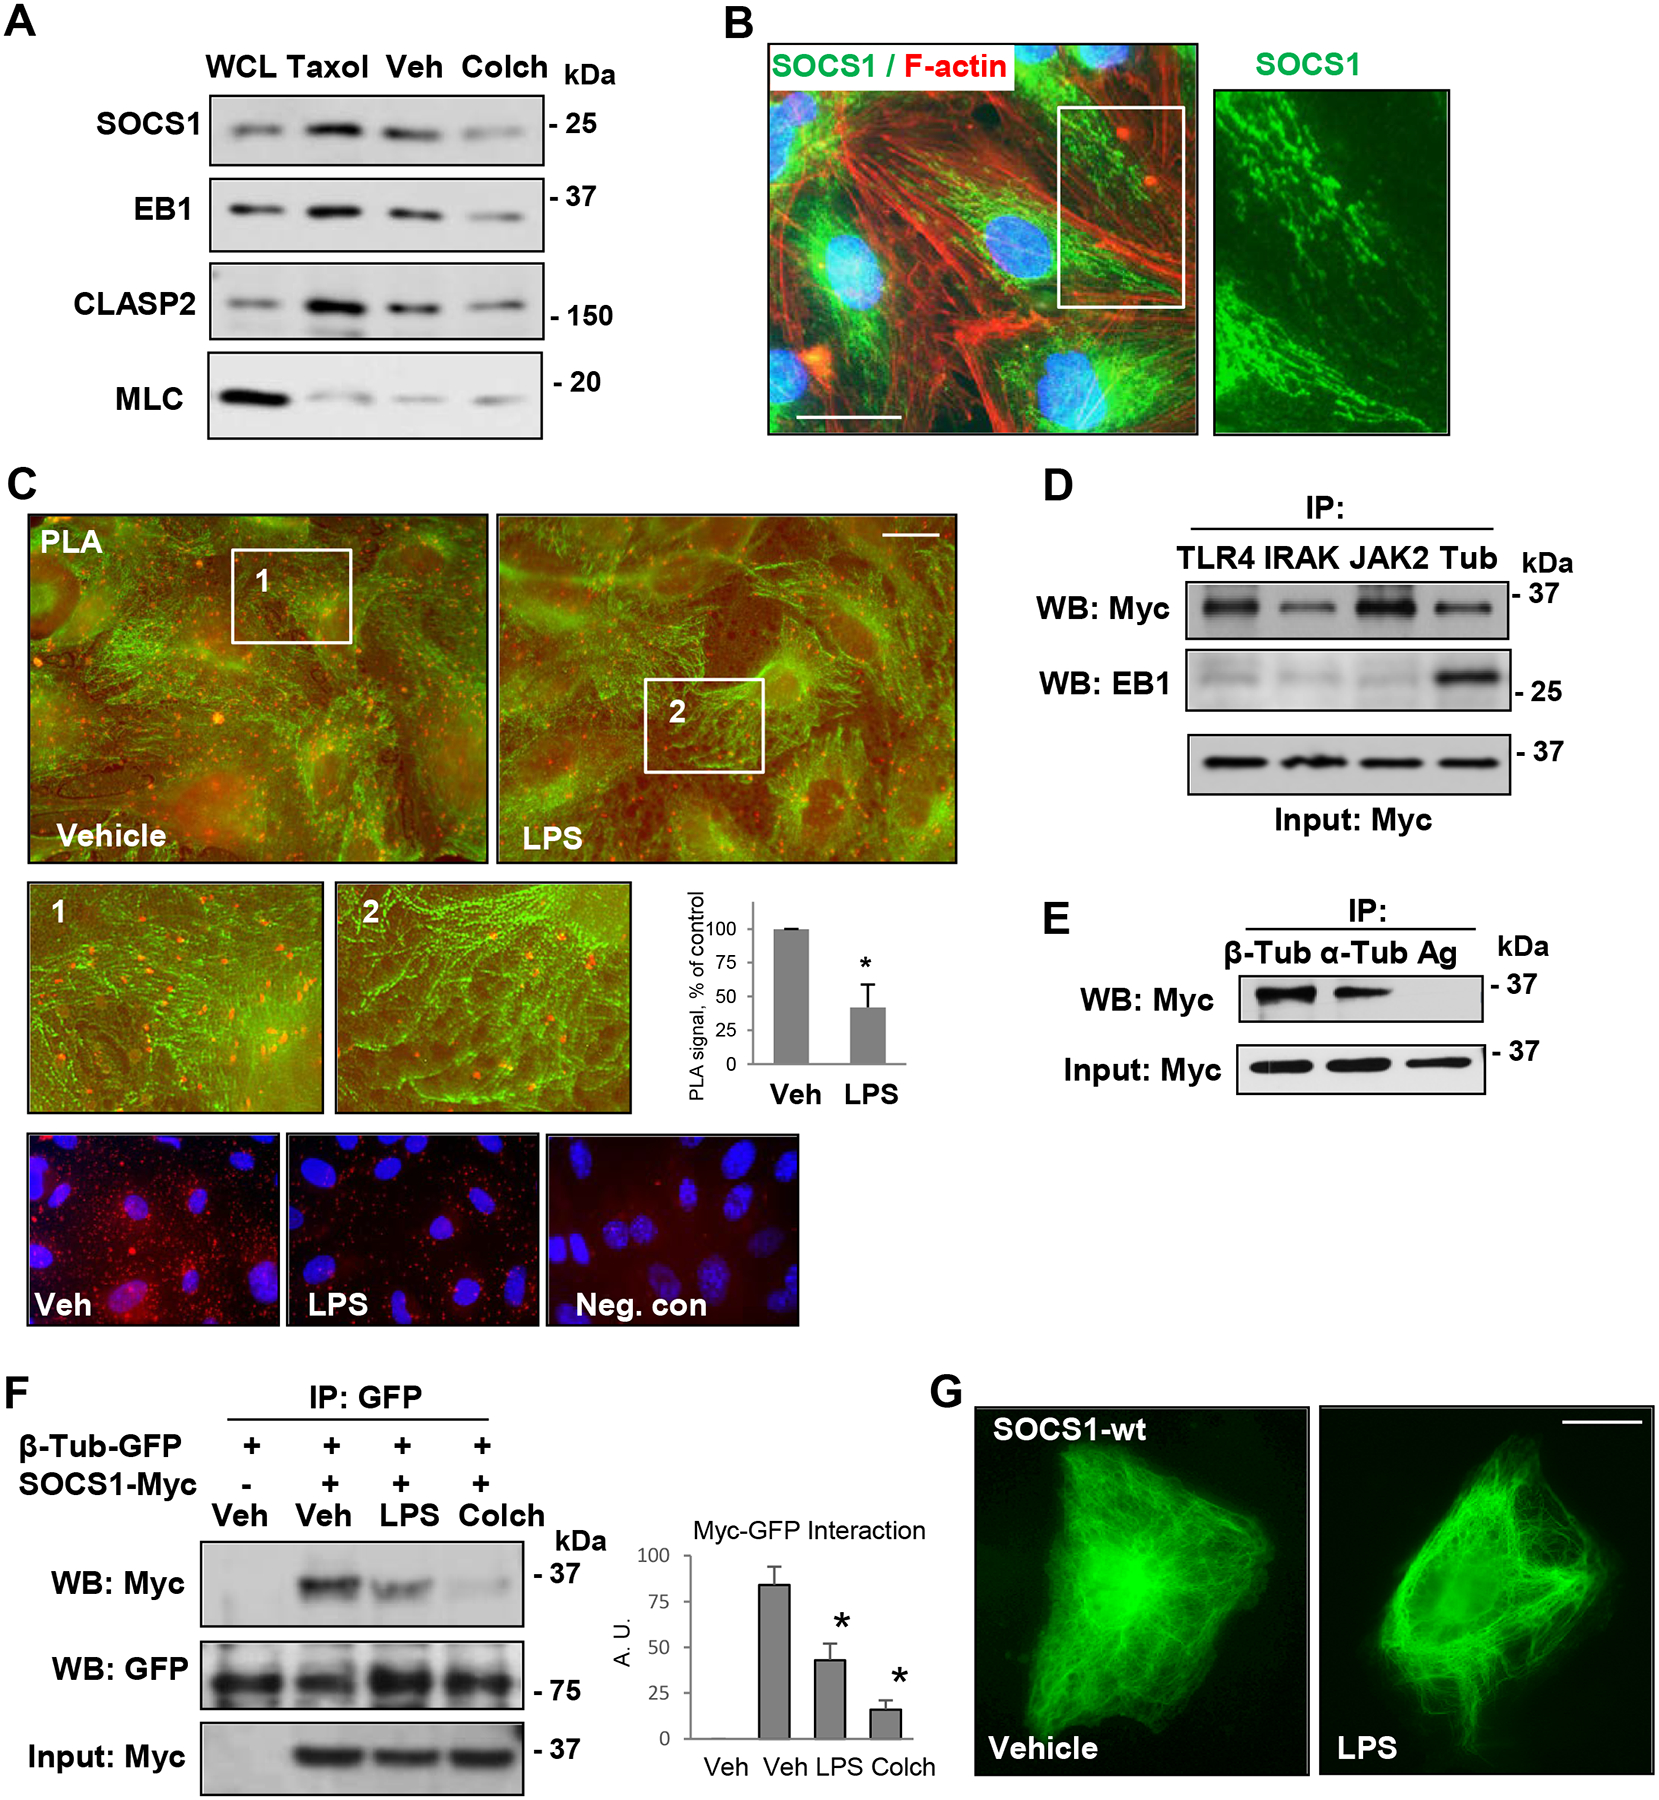
Figure 4. SOCS1 is associated with MT.

A – Cells were treated with MT polymerizing (Taxol, 0.5 μM, 30 min) and depolymerizing (Colchicine, 0.5 μM, 1 h) agents followed by MT fractionation. The first lane represents whole cell lysates (WCL). Probing with MLC antibody was used as a negative control. B – Immunofluorescence staining of unstimulated pulmonary EC with SOCS1 antibody (green) and Texas Red phalloidin (red). Higher magnification image (inset) depicts details of SOCS1 localization. Bar: 10 μm. C – Proximity ligation assay (PLA) in control and LPS-stimulated cells was performed using SOCS1 and α-tubulin antibodies followed by immunofluorescence staining with β-tubulin (green) antibody. PLA signal of SOCS1 co-localization with α-tubulin is reflected by red fluorescence. Bar: 10 μm. The insets represent higher magnification images; bar graph depicts quantification of PLA fluorescence signal; n=6; *p<0.05. Lower panel presents PLA signal (red) and nuclear counterstaining with DAPI (blue) in vehicle- and LPS-stimulated cells as well as a negative control (PLA reaction without primary SOCS1 antibody). D and E – Cells were transfected with Myc-SOCS1-WT, and co-IP assays were performed with indicated antibodies. SOCS1 interaction with proteins of interest was determined by probing with Myc antibody. Probing for EB1 was used as a negative control for SOCS1 interactions with TLR4, IRAK and JAK2 (D). IP with protein G agarose served as a negative control (E). Probing with Myc antibody was used as an input control for IP assays. F – EC co-expressing GFP-β-tubulin and Myc-SOCS1 were stimulated, with LPS (100 ng/ml, 6 h) or colchicine (0.5 μM, 1h) followed by co-IP with GFP antibody. The presence of SOCS1 in immunocomplexes was detected by western blot Myc antibody; membrane reprobing for GFP was used to verify uniform IP efficiency. Bar graph depicts the quantification of Western blot probed with Myc; n=5; *p<0.05. G – Cells transfected with Myc-SOCS1-WT plasmid were treated with vehicle or LPS followed by immunostaining with Myc antibody. Bar: 10 μm.
