FIGURE 2.

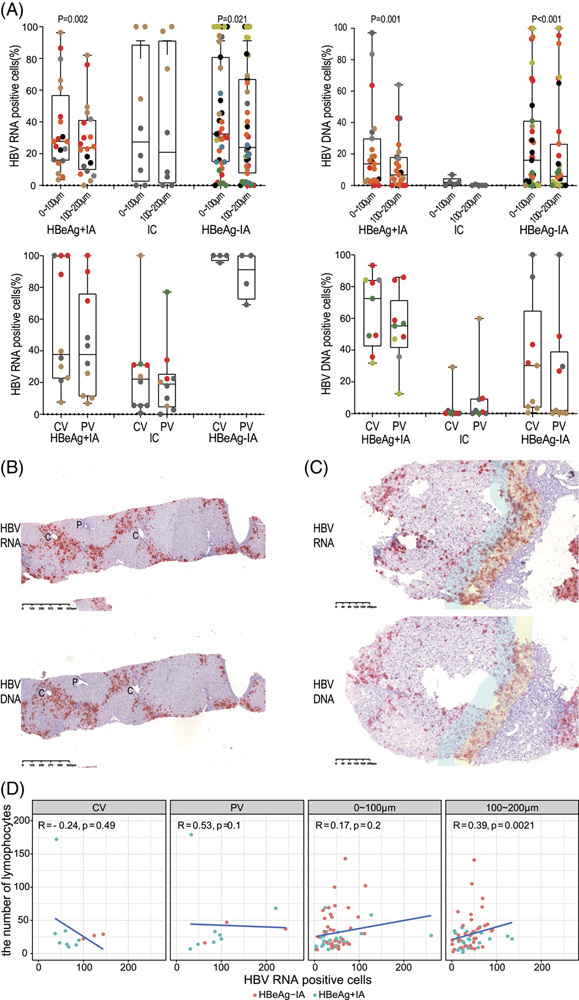
Spatial relationship between HBV-infected hepatocytes and salient pathological features of chronic hepatitis B. (A) Distribution of HBV RNA-positive and DNA-positive hepatocytes in hepatitis B patients. Samples with positivity rates of <80% were included in the data analysis. The percentage of HBV RNA-positive cells from the immune-tolerant (IT) patients are all >80% so that IT patients are not included in this figure. For patients with METAVIR staging scores ≤2, we compared the positive cells around the central venous areas and portal areas. For patients with METAVIR staging scores ≥ 3, we compared the positive hepatocytes that were 0–100 μm and 100–200 μm away from the fibrotic areas. Different symbols represent different patients. The symbols in same color are nonrepetitive fields from 1 patient. (B) One peculiar case wherein the HBV-infected hepatocytes are mostly found in zone 3 of the liver acinus (×40). (C) The yellow areas are located near the fibrotic areas, while the blue areas are 100–200 μm away from the fibrotic area. For HBeAg-positive immune-active (HBeAg+IA) and HBeAg-negative immune-active (HBeAg−IA) patients, more positive hepatocytes were observed near the fibrotic areas (×40). (D) Relationship between lymphocytes and HBV-positive cells in different areas in situ in patients with HBeAg+IA and HBeAg−IA. For patients with METAVIR staging scores ≤2, the positive cells and lymphocytes around the central venous areas and portal areas were compared. For patients with METAVIR staging scores ≥3, the positive hepatocytes and lymphocytes that were 0–100 μm and 100–200 μm away from the fibrotic areas were compared. Red points represent patients with HBeAg−IA patients, while blue points represent patients with HBeAg−IA. Abbreviations: CV, central vein; PV, portal vein.
