FIGURE 3.

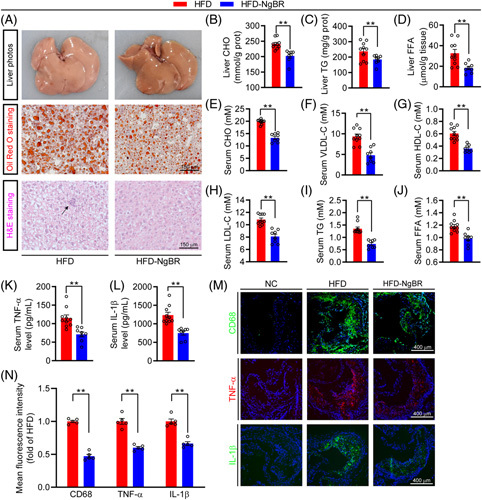
NgBR overexpression improves NAFLD, hyperlipidemia and inflammatory response. Liver samples of mice in Figure 2 were used to complete the following assays: liver photos, oil red O staining of liver frozen sections and H&E staining of liver paraffin sections with an arrow indicates inflammatory cells in the liver (A). Quantitative analysis of liver CHO (B), TG (C), and FFA (D) with total liver lipid extract. Mouse serum samples in Figure 2 were used to determine levels of CHO (E), VLDL-C (F), HDL-C (G), LDL-C (H), TG (I) and FFA (J). Serum TNF-α (K) and IL-1β (L) levels were determined by Elisa. (B–L) *p<0.05, **p<0.01, n=10 (HFD group), n=8 (HFD-NgBR group). (M and N) Expression of CD68, TNF-α, and IL-1β in aortic root cross sections were detected by immunofluorescent staining with the corresponding antibody. NC: primary antibody was replaced by rabbit normal IgG. **p<0.01, n=5. Abbreviation: HFD, high-fat diet.
