Figure 1.
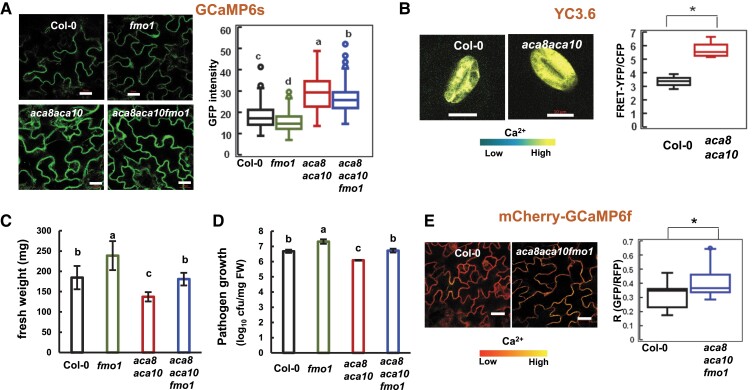
Resting [Ca2+]cyt is elevated in the aca8 aca10 mutants. A) Images and quantification (in box plot) of GFP fluorescence signals from the reporter GCaMP6s in epidermal cells of isogenic plants of wild-type Col-0, fmo1, aca8 aca10, and aca8 aca10 fmo1. Plants were grown at 22 °C for 21 d. The scale bar is 20 μm. B) Images and quantification (in box plot) of fluorescence signal ratios of FRET-YFP and CFP from the reporter YC3.6 in guard cells of wild-type Col-0 and aca8 aca10 plants that were grown in soil for 21 d. The scale bar is 10 μm. C) Fresh weights of Col-0, fmo1, aca8 aca10, and aca8 aca10 fmo1 plants after grown under constant light for 21 d at 22 °C. Error bars represent standard deviations (SD) from 9 plants for each genotype. D) Growth of virulent pathogen Pseudomonas syringae pathovar tomato (Pst) DC3000 in Col-0, fmo1, aca8 aca10, and aca8 aca10 fmo1 plants grown under a 12/12-h photoperiod for 14 d. Shown are log10 values of bacterial number (in colony forming unit, cfu) per mg fresh weight (FW) of leaves at 3 d after infection. Error bars represent standard deviations (SD) from 3 biological replicates in 1 experiment. Shown is a result from 1 experiment and similar results were obtained from 3 experiments. E) Images and quantification of fluorescence signal ratios GFP/mCherry from the reporter mCherry-GCaMP6f in leaf epidermal cells of the wild-type Col-0 and the aca8 aca10 fmo1 mutant plants. The scale bar is 20 μm. For A) and E), fluorescence signals were measured from the region of interest of 2 × 2 μm, and the average of signals or signal ratios from 4 regions of interest (ROIs) was used as the signal or signal ratio for one cell. Data were obtained from at least 60 cells (2 cells/plant) for each genotype. For B), fluorescence signals were acquired from a- ROI encompassing the entire guard cell. More than 10 cells (1 cell/plant) for each genotype were measured. For box-whisker plots in A), B), and E), the top and bottom sides of the box are the upper and lower quartiles; the line in the box is the median; the whiskers mark the range from maximum to minimum or 1.5 times the interquartile range with outliers represented as a circle. For B) and E), “*” indicates a statistically significant difference between samples determined by Student's t-test (P < 0.05). For A), C), and D), different letters indicate significant differences among samples by ANOVA test (P < 0.05).

