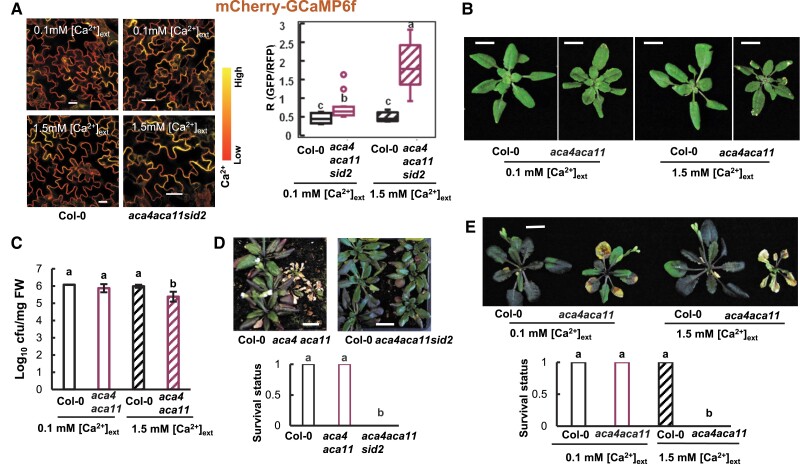
Figure 4.
The aca4 aca11 mutant has a reduced autoimmunity under low [Ca2+]ext and is more chilling susceptible compared to the wild type. A) Images and quantification (in box plot) of fluorescence signal ratios of GFP/RFP from the reporter mCherry-GCaMP6f in leaf epidermal cells of the wild-type Col-0 and the aca4 aca11sid2 mutant plants containing the reporter grown hydroponically at 0.1 or 1.5 mM [Ca2+]ext. The scale bar is 20 μm. More than 10 cells (1 cell/plant) for each genotype were measured for quantification. Different letters indicate statistically significant differences tested by ANOVA (P < 0.05). For the box-whisker plot, the top and bottom sides of the box are the upper and lower quartiles; the line in the box is the median; the whiskers mark the range from maximum to minimum or 1.5 times the interquartile range with outliers represented as a circle. B) Phenotypes of wild-type Col-0 and aca4 aca11 plants grown hydroponically at 0.1 or 1.5 mM [Ca2+]ext for 21 d. C) Growth of Pst DC3000 in wild-type Col-0 and aca4 aca11 seedlings hydroponically grown under 0.1 and 1.5 mM [Ca2+]ext. Seedlings were grown under a 12/12-h photoperiod at 22 °C for 14 d before they were infected with Pst DC3000. Shown are mean values and SD (standard deviation) of log10 value of the bacterial number (cfu per mg FW) in leaves at 3 d after infection from 3 biological repeats in one representative experiment. Similar results were obtained from 2 independent experiments (each with 3 biological repeats). Different letters indicate statistically significant differences tested by ANOVA (P < 0.05). D) Phenotype and survival status of wild-type Col-0, aca4 aca11, and aca4 aca11 sid2 grown at 10 °C (following 5 d of germination and growth at 22 °C). Plant images were taken at 1 mo's growth at 10 °C, and the survival status (1 as live and 0 as dead) was analyzed at 3 mo’ growth at 10 °C. More than 27 plants were analyzed for each genotype. Different letters indicate statistically significant differences tested by ANOVA (P < 0.05). E) Phenotypes and survival status of wild-type Col-0 and aca4 aca11 plants grown hydroponically under 0.1 and 1.5 mM [Ca2+]ext at 22 °C for 14 d and then 10 °C for 28 d. More than 22 plants for each genotype were analyzed. Different letters indicate statistically significant differences tested by ANOVA (P < 0.05).

