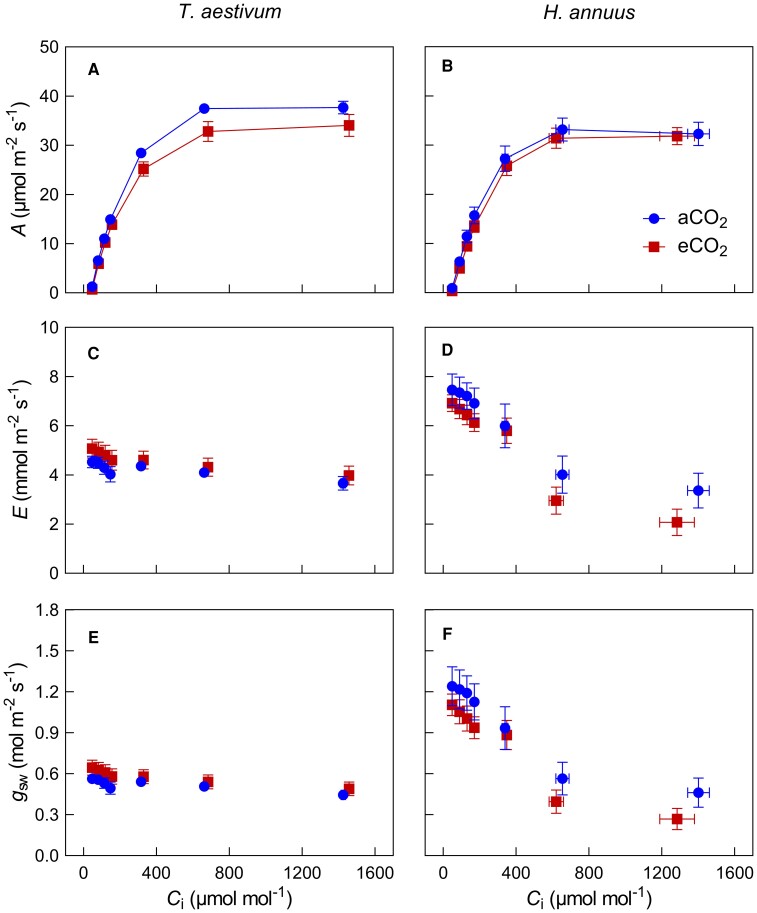
Figure 1.
Net CO2 assimilation rate (A), transpiration rate (E), and stomatal conductance for water vapor (gsw) in response to short-term variation of intercellular CO2 concentration (Ci) for wheat (T. aestivum) and sunflower (H. annuus). Circles refer to ambient (410 μmol mol−1) growth CO2, and squares refer to elevated (820 μmol mol−1) growth CO2. Data are shown as mean ± SE (n = 6).

