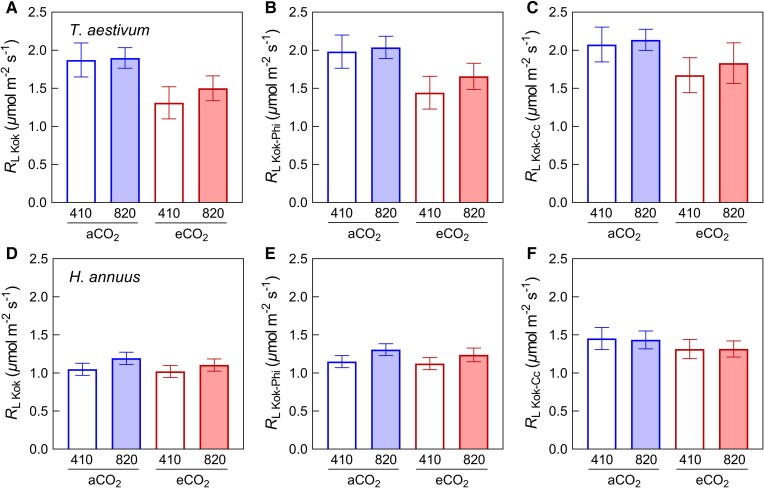
Figure 4.
Effects of growth CO2 treatments (aCO2 and eCO2) and measurement conditions (410 and 820 ppm CO2) on respiration rates in the light (RL) estimated by three methods for wheat (T. aestivum) and sunflower (H. annuus). RL was measured by the Kok (A and D), Kok-Phi (B and E), and Kok-Cc (C and F) methods. Data are mean ± SE (n = 5–6). The results of ANOVA tests are shown in Table 2.

